Automatic 3D Reconstruction from Multi-Date Satellite Images
CVPR 2017 - Earth Vision Workshop
- Gabriele Facciolo
- Carlo de Franchis
- Enric Meinhardt-Llopis

Abstract
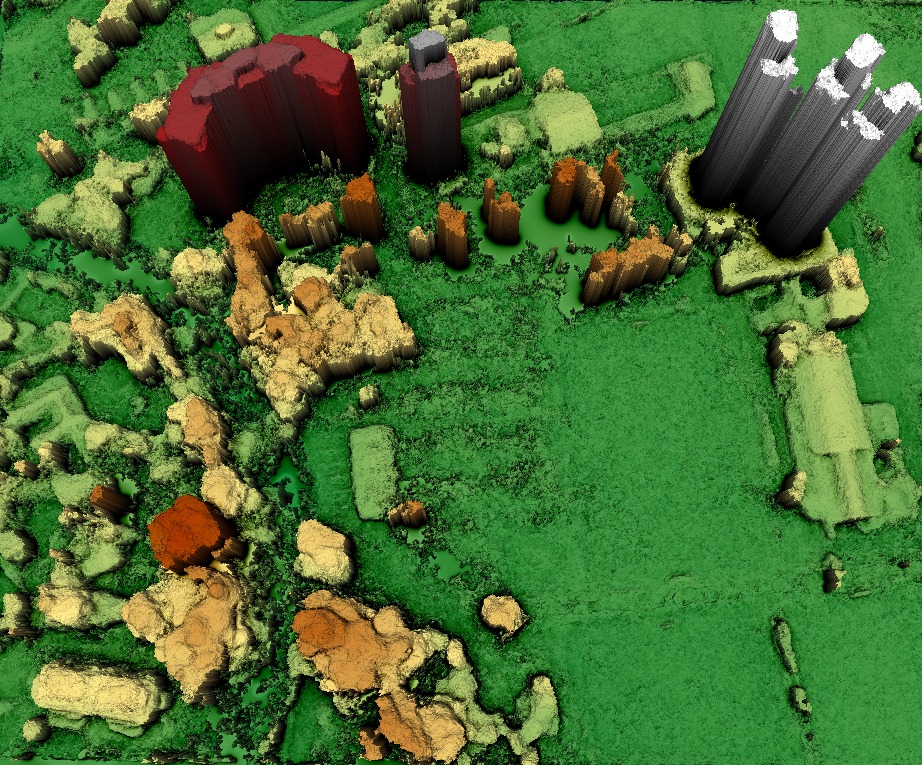
We propose an algorithm for computing a 3D model from several satellite images of the same site. The method works even if the images were taken at different dates with important lighting and vegetation differences. We show that with a large number of input images the resulting 3D models can be as accurate as those obtained from a single same-date stereo pair. To deal with seasonal vegetation changes, we propose a strategy that accounts for the multi-modal nature of 3D models computed from multi-date images. Our method uses a local affine camera approximation and thus focuses on the 3D reconstruction of small areas. This is a common setup in urgent cartography for emergency management, for which abundant multi-date imagery can be immediately available to build a reference 3D model. A preliminary implementation of this method* was used to win the IARPA Multi-View Stereo 3D Mapping Challenge 2016. Experiments on the challenge dataset are used to substantiate our claims.
(*) The method relies on the open source S2P satellite stereo pipeline.About the IARPA MVS challenge dataset
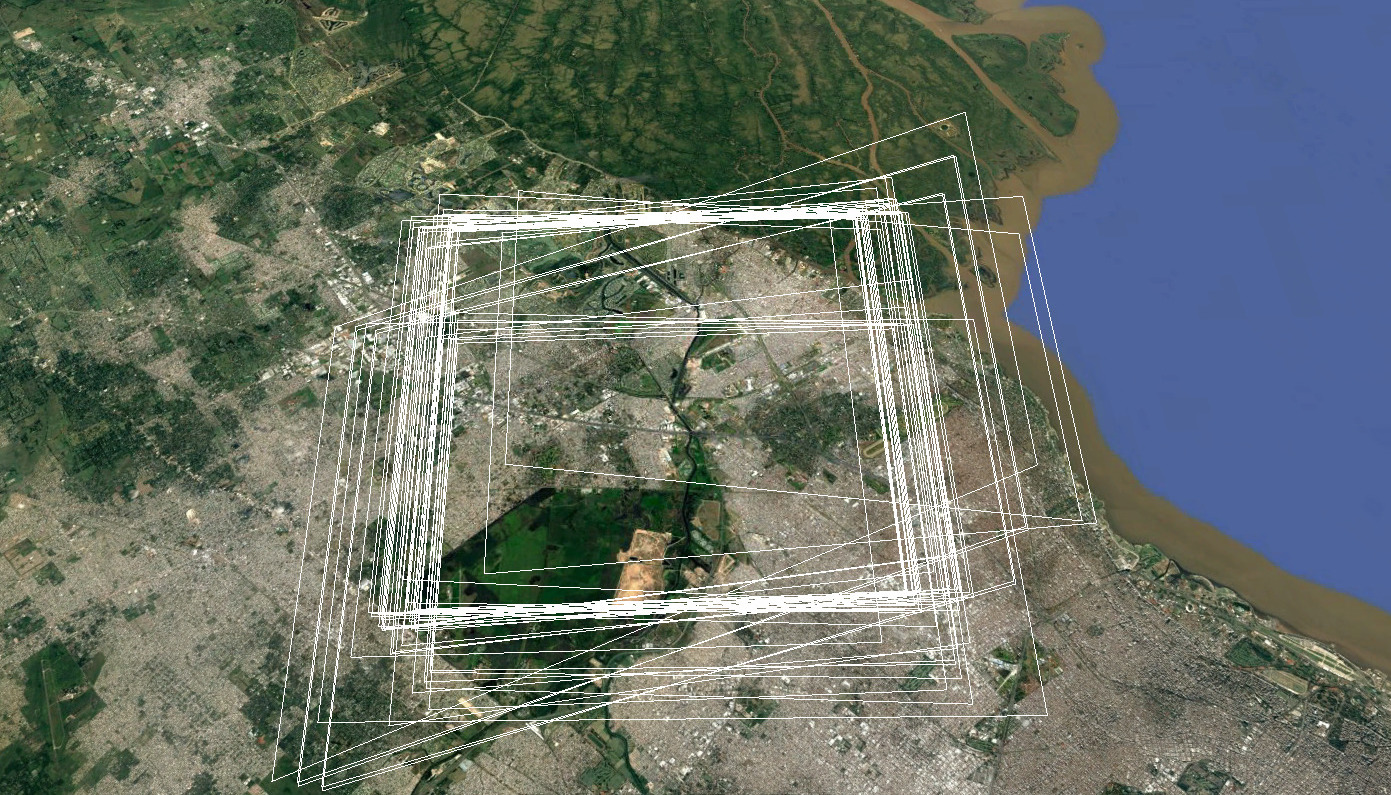
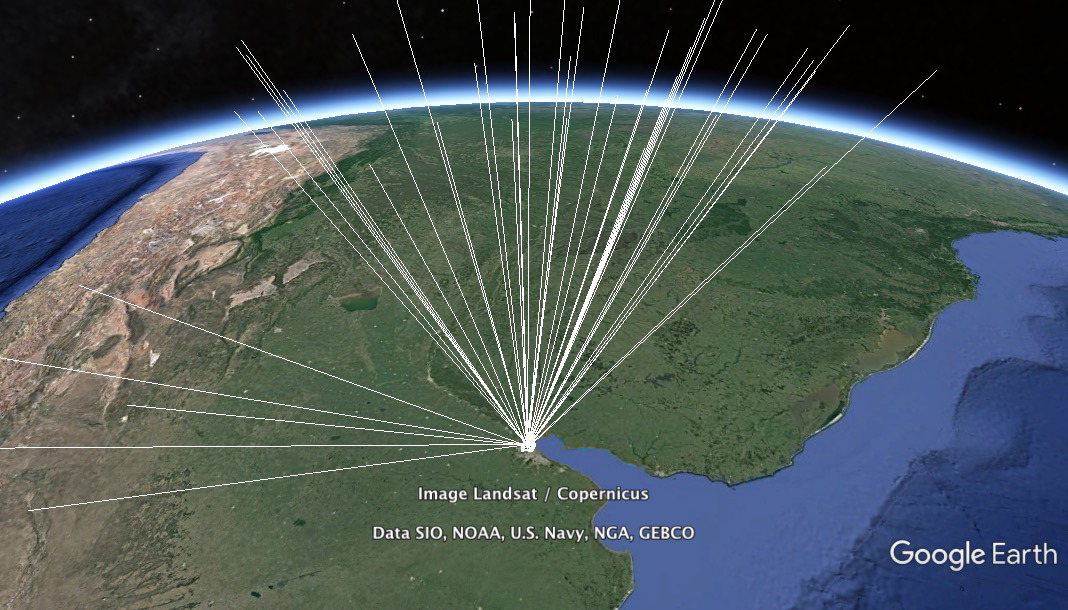
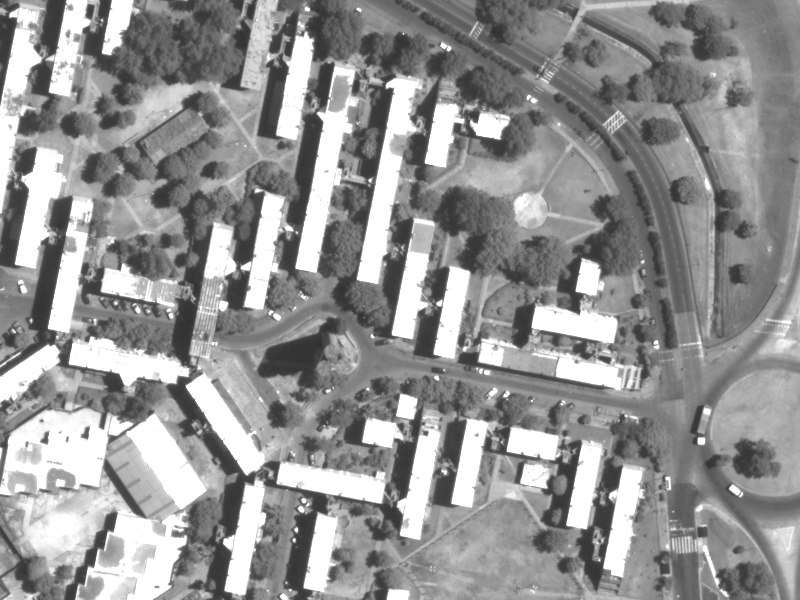
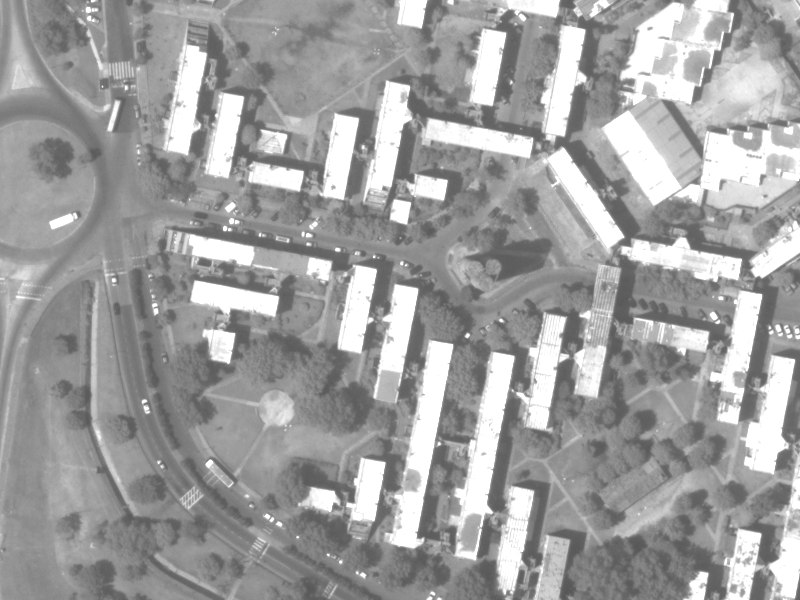
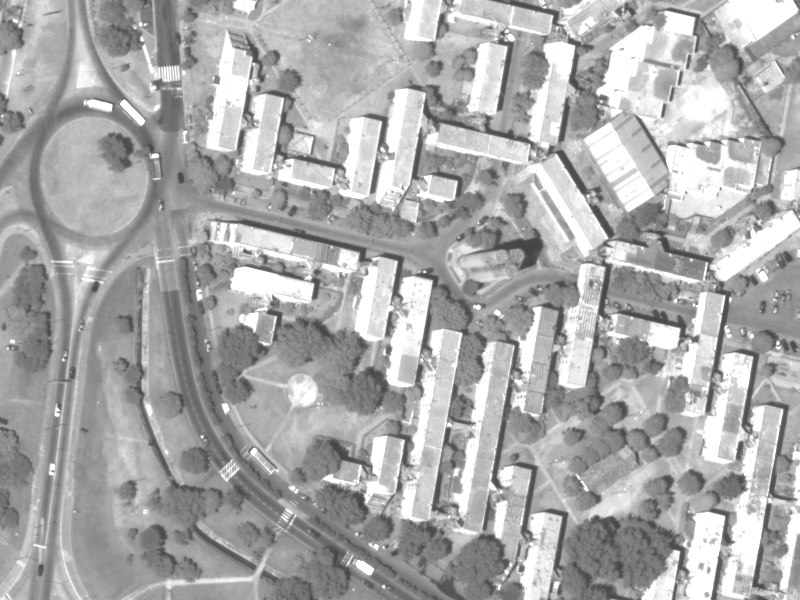
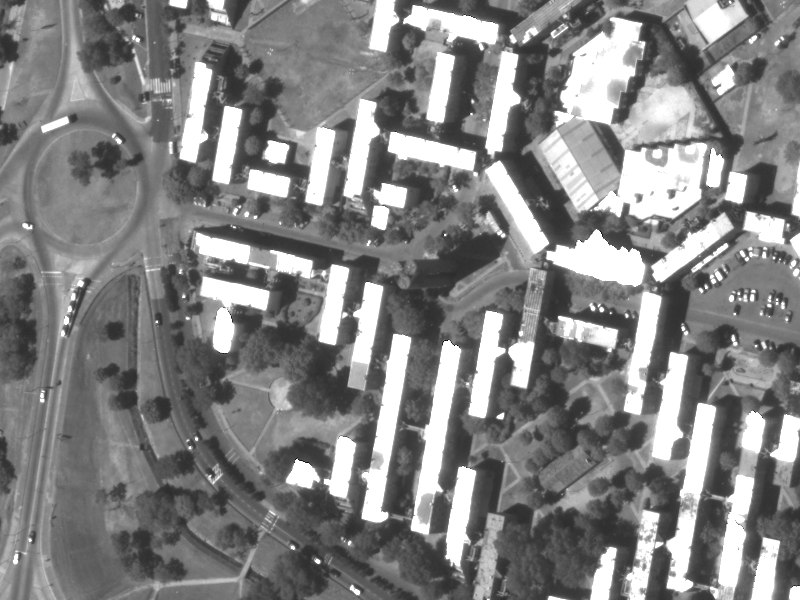
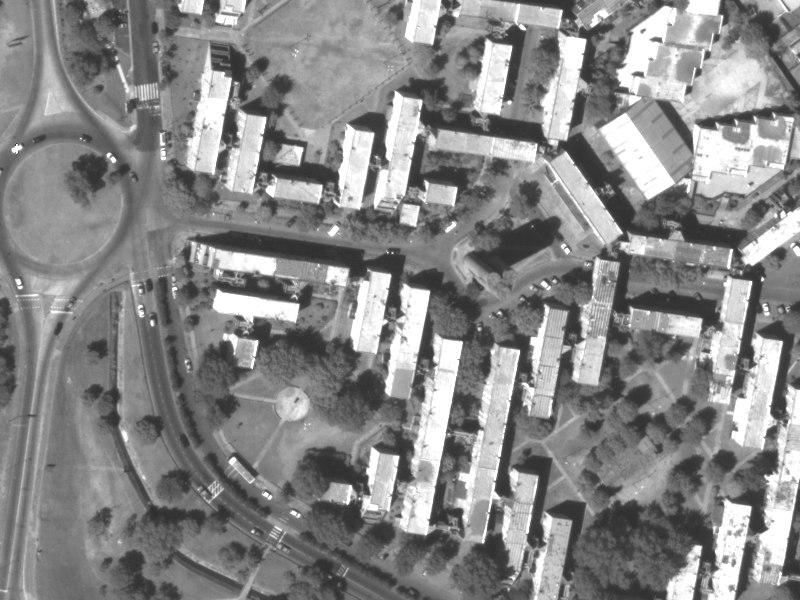
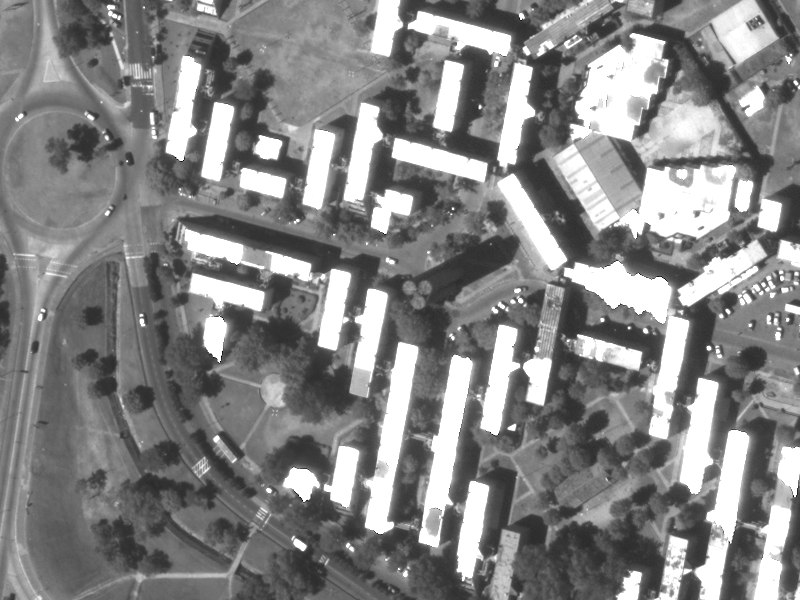
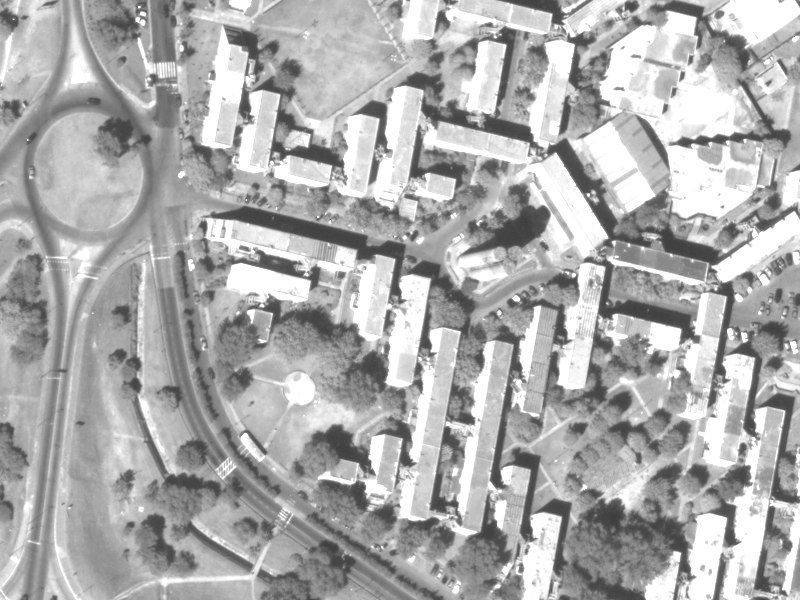
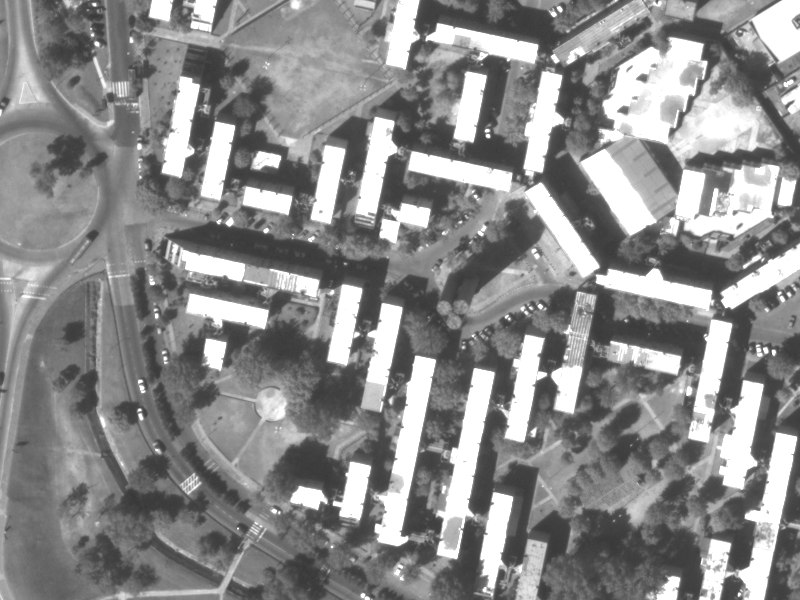
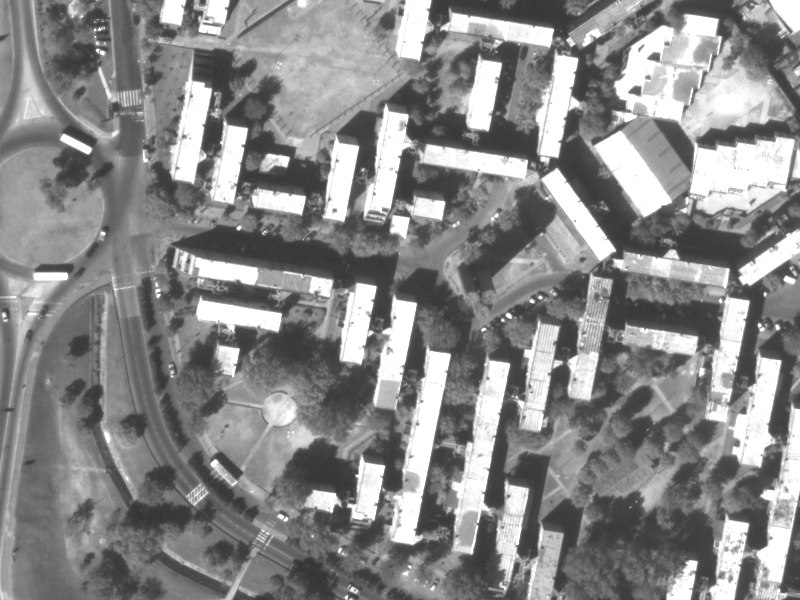
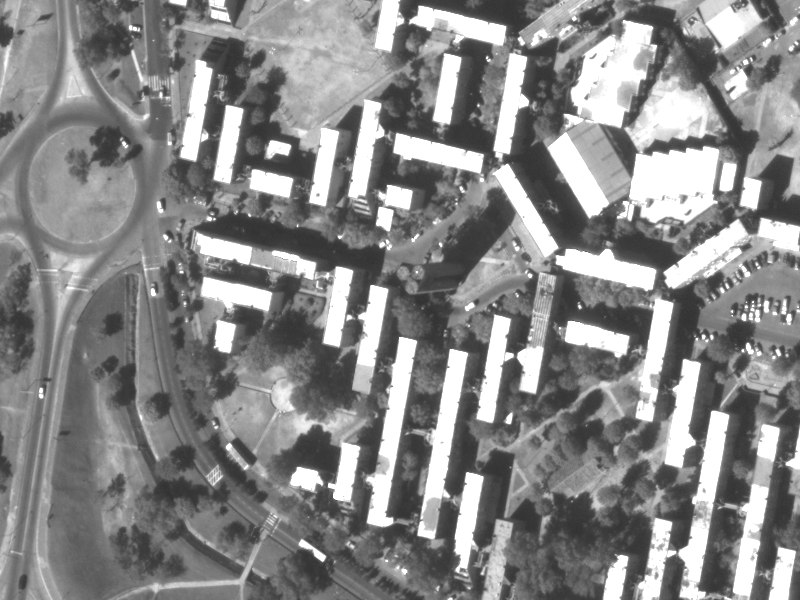
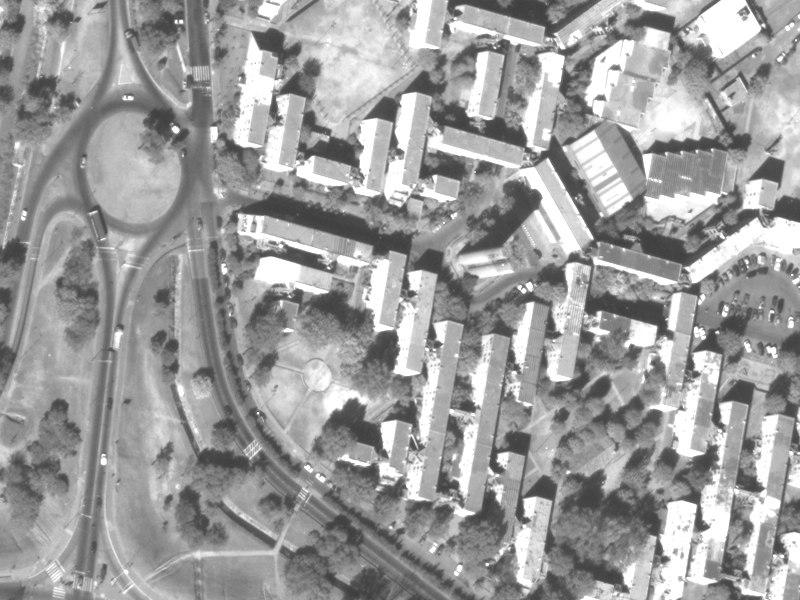
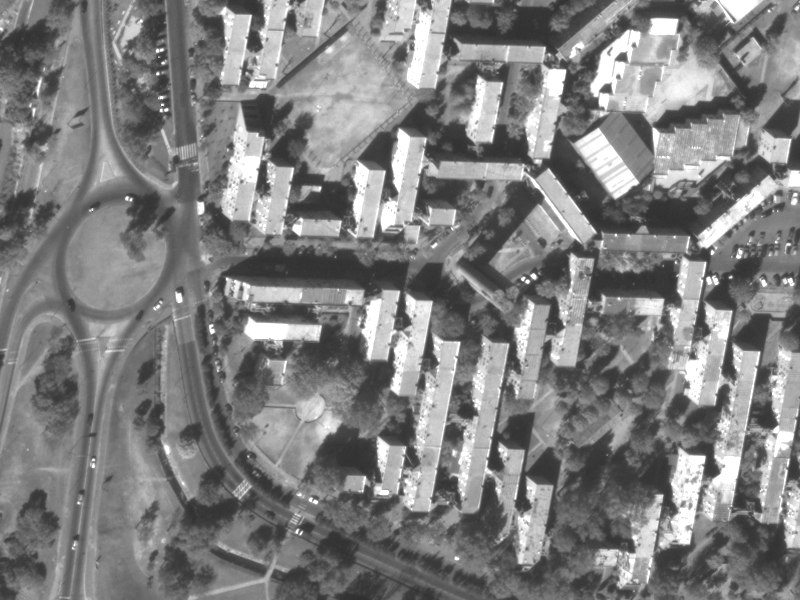
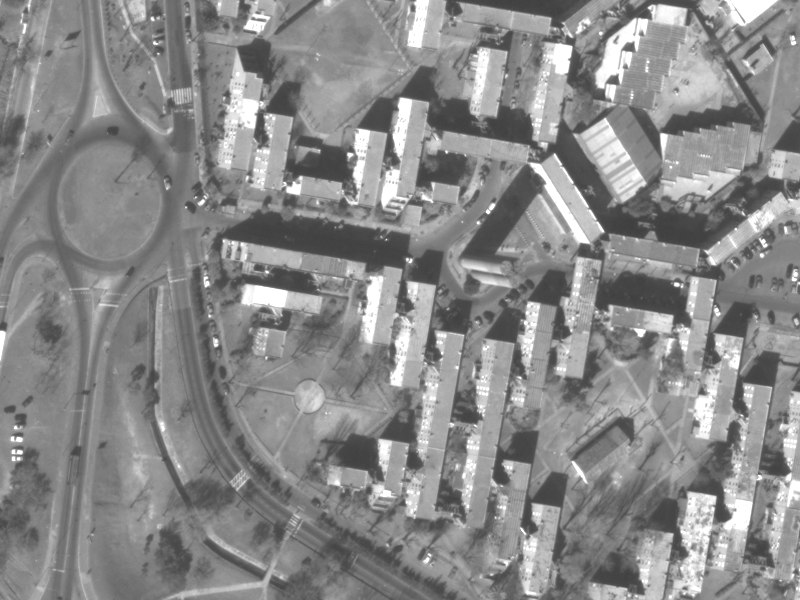
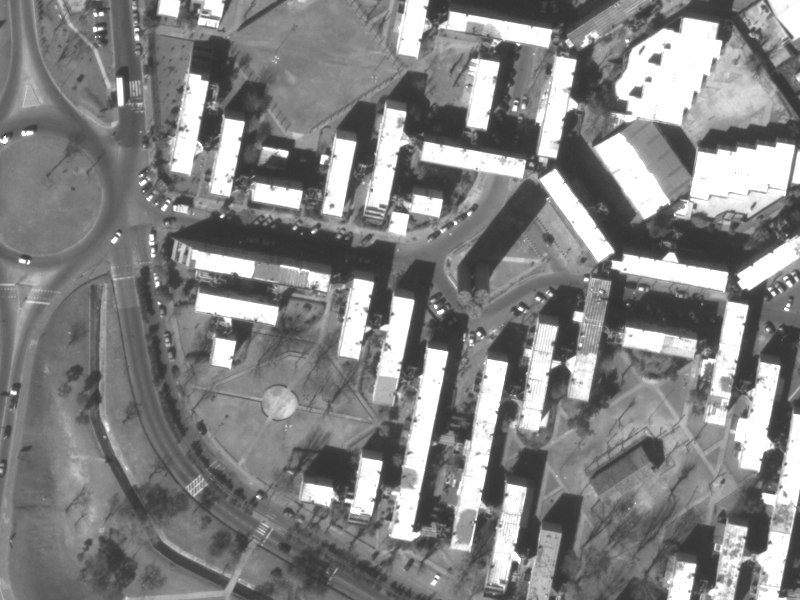
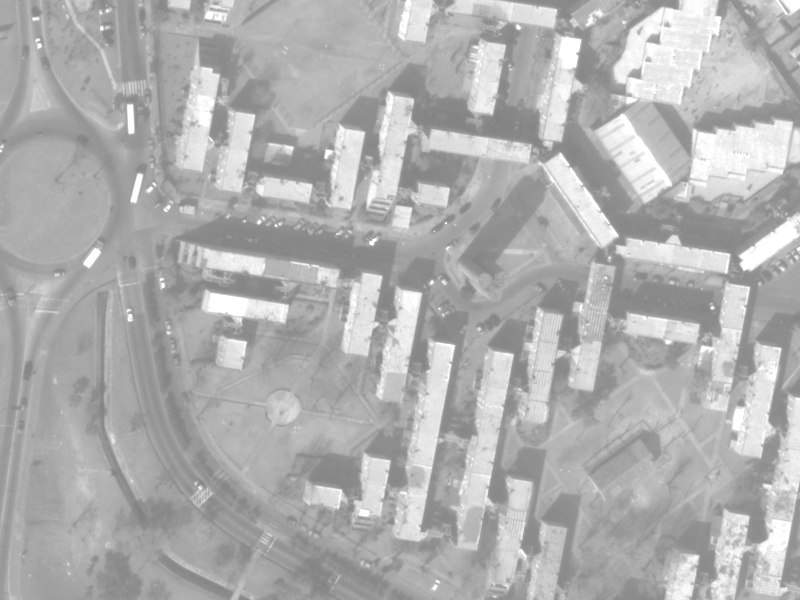
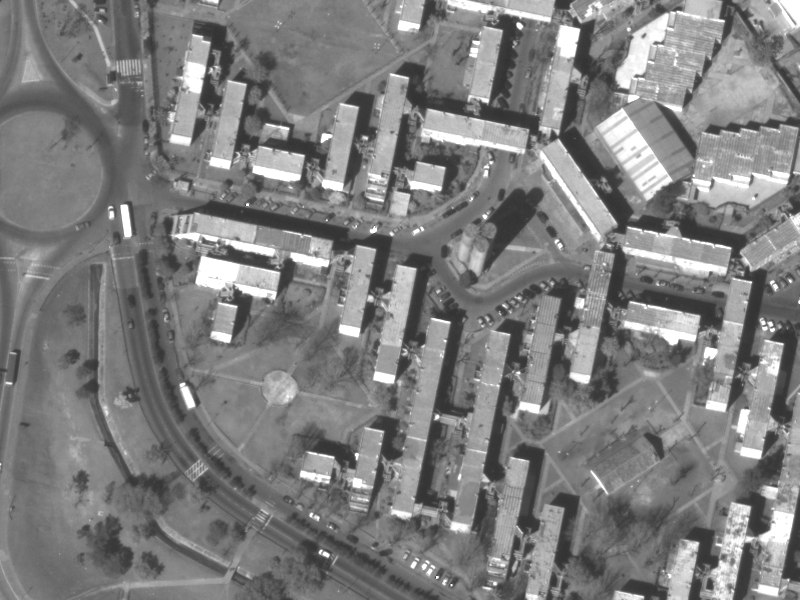
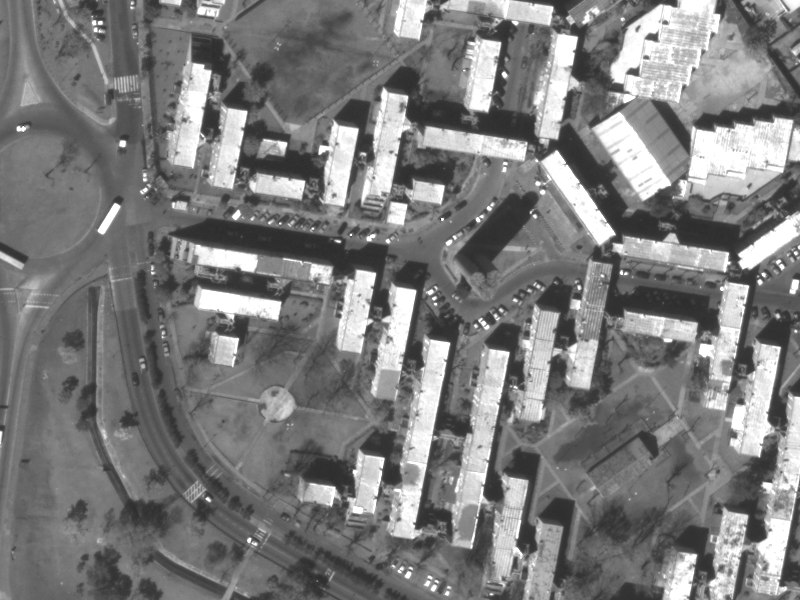
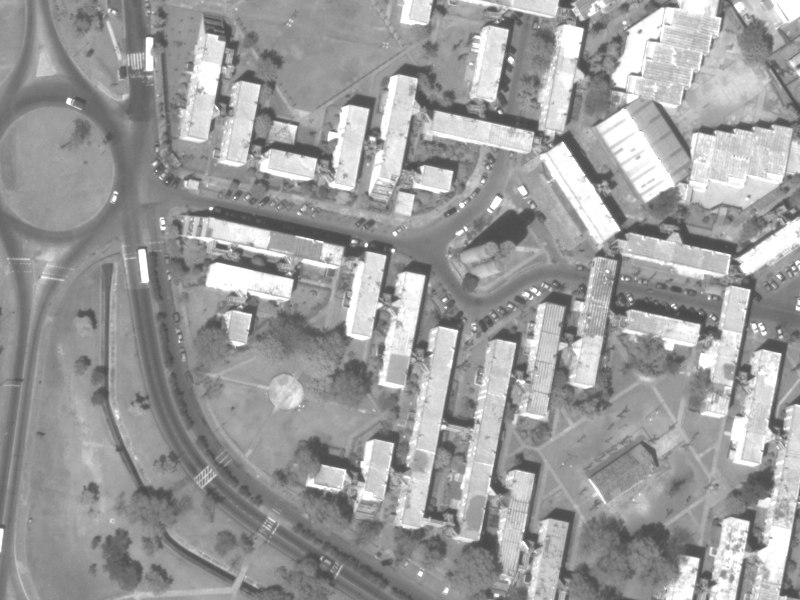
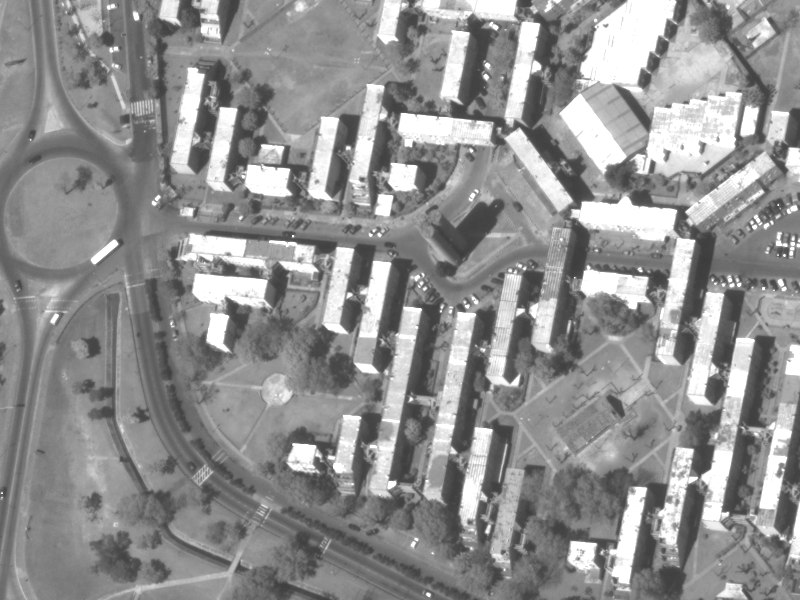
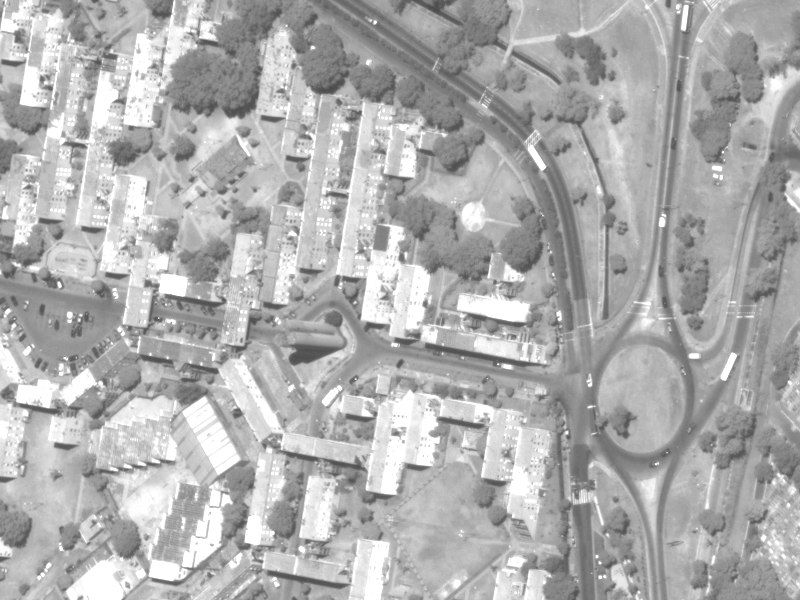
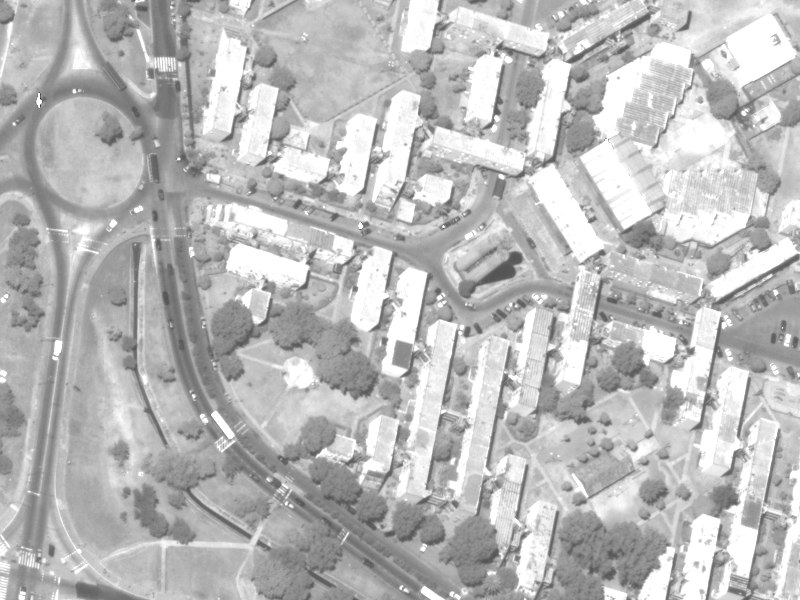
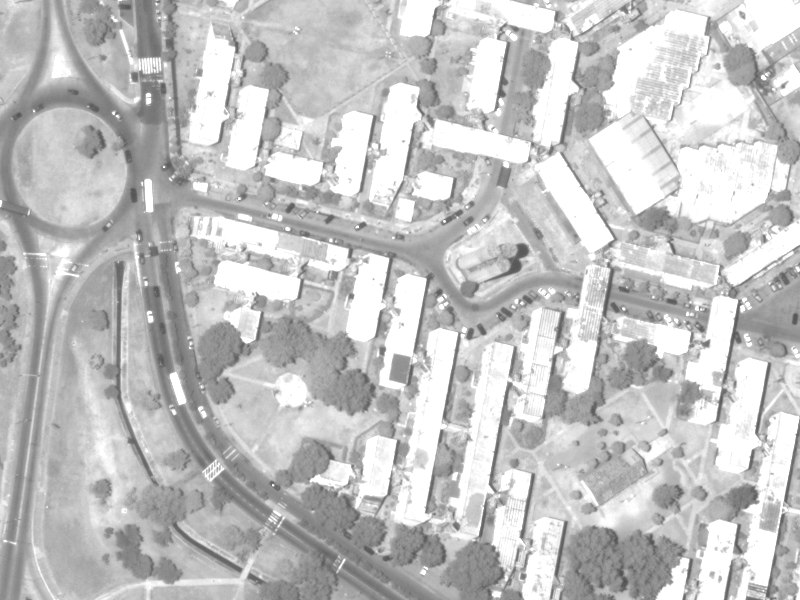
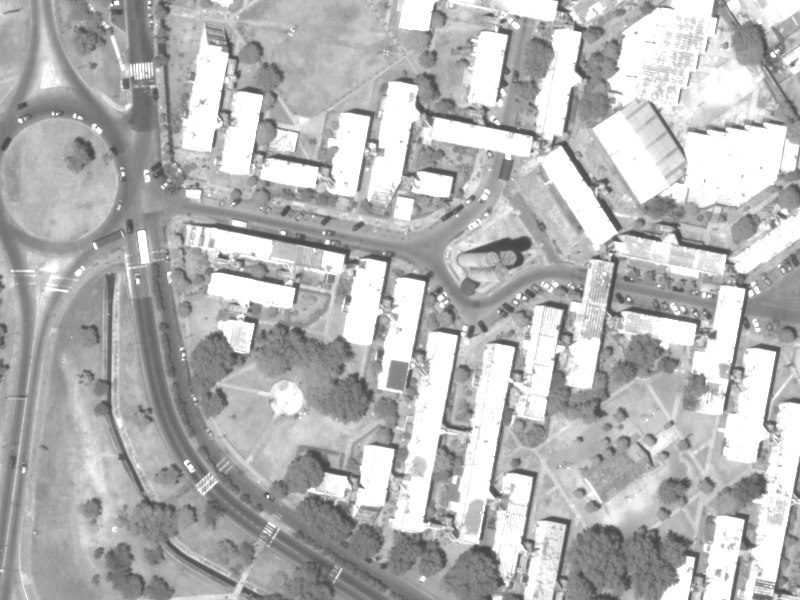
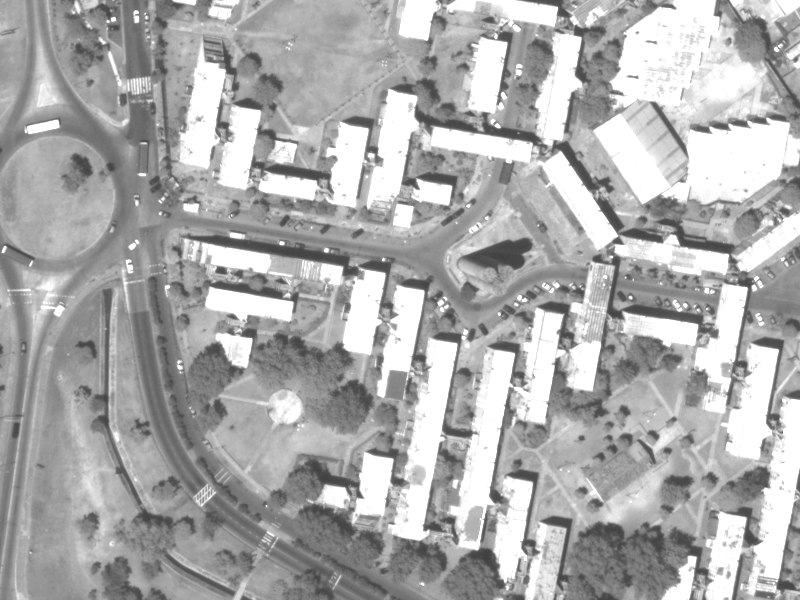
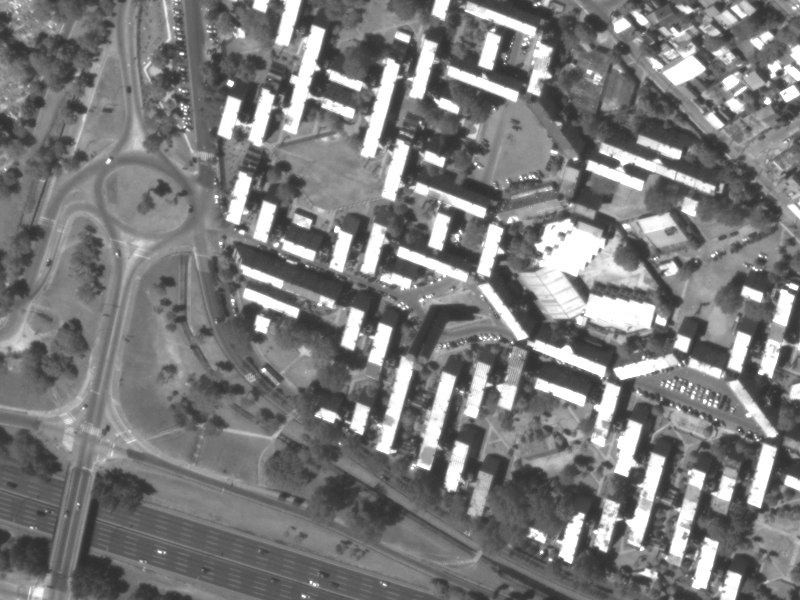
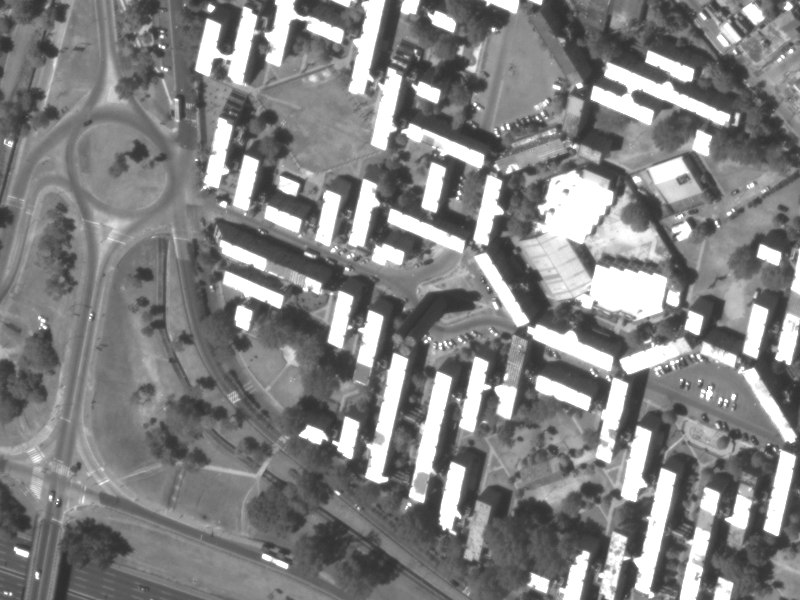
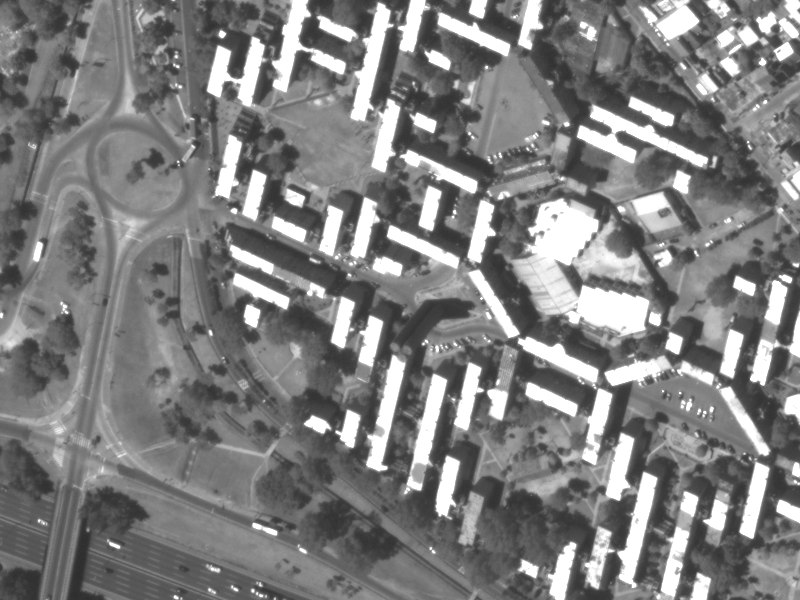
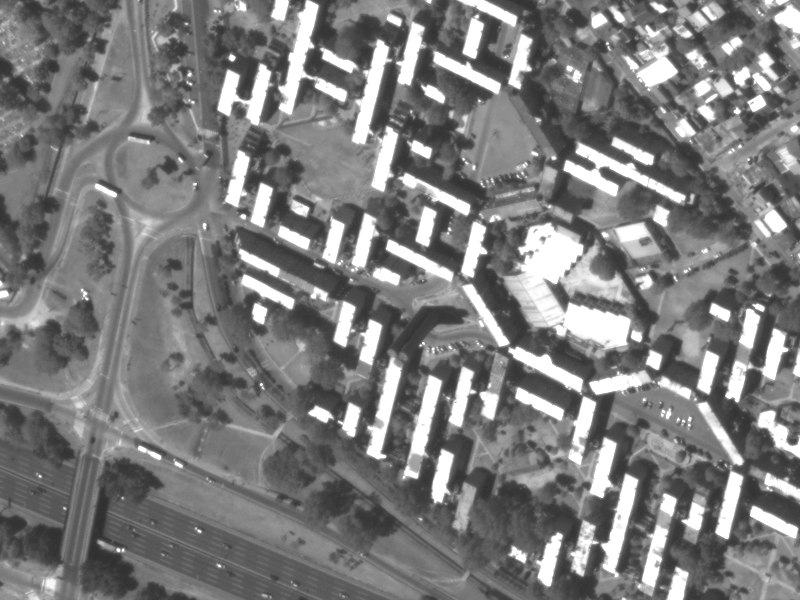
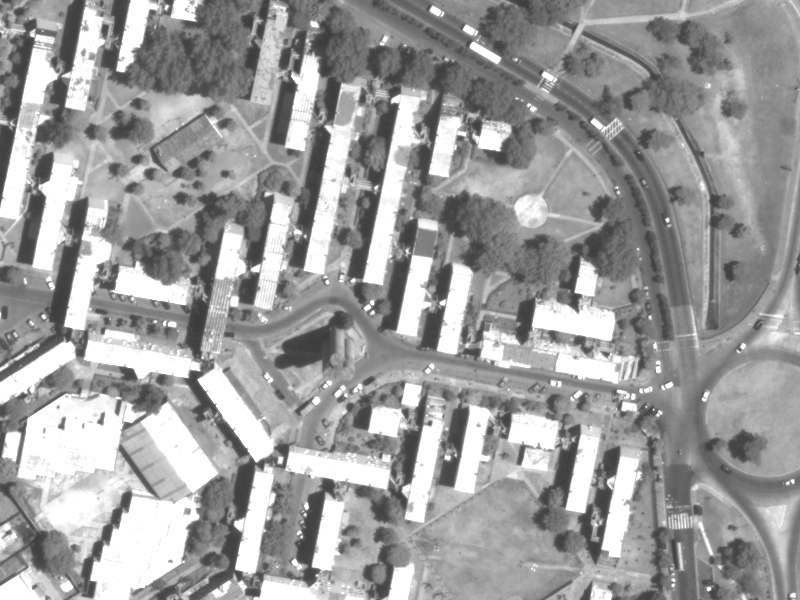
The IARPA MVS dataset contains 47 WorldView images of Buenos Aires taken over a period of 14 months. An orthorectified view of the whole scene can be seen here.
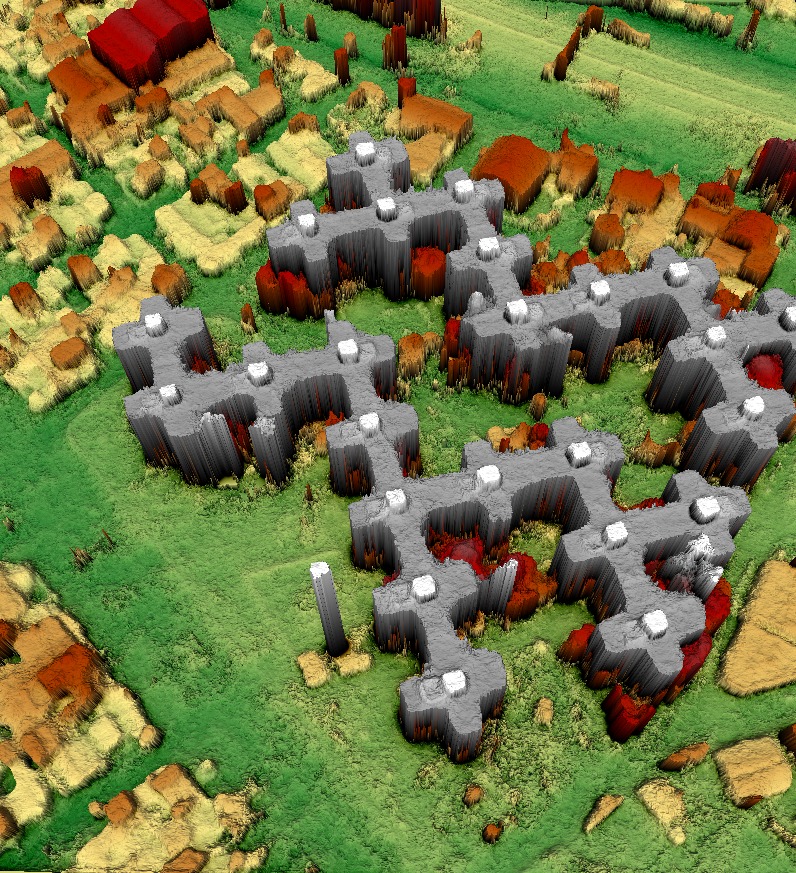
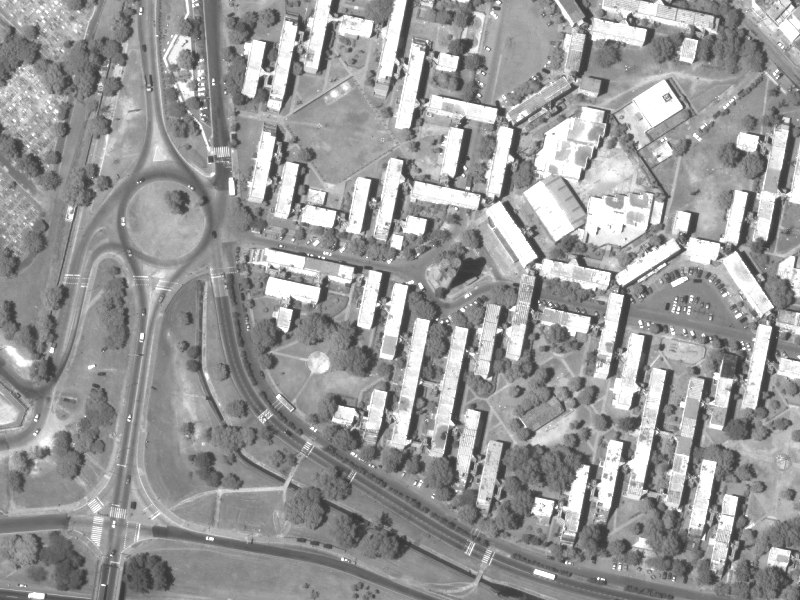
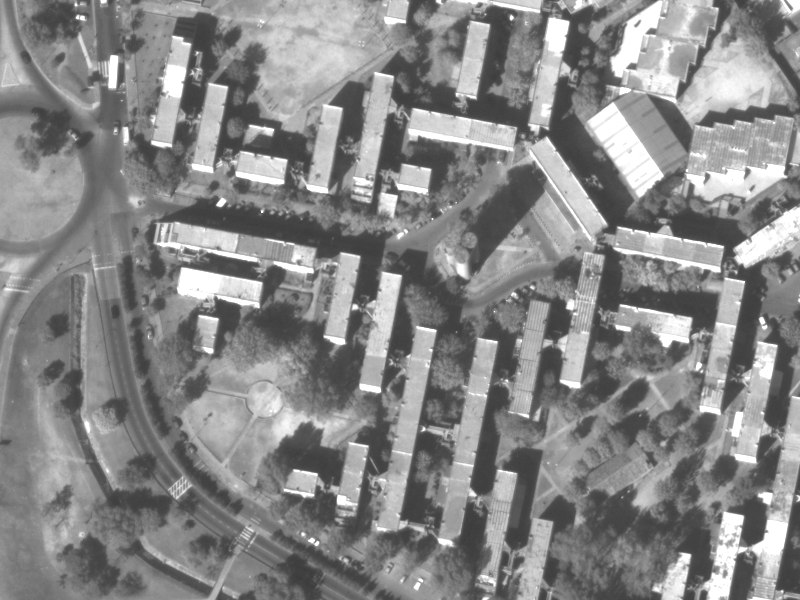
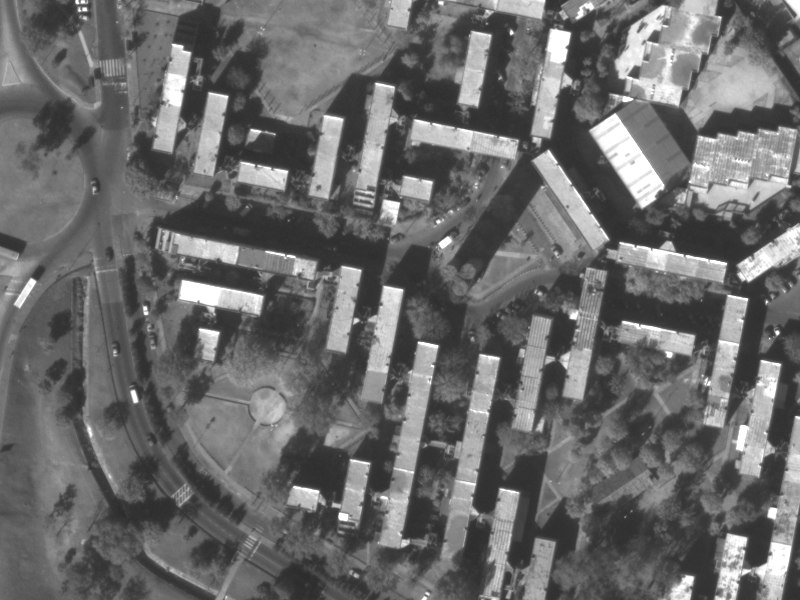
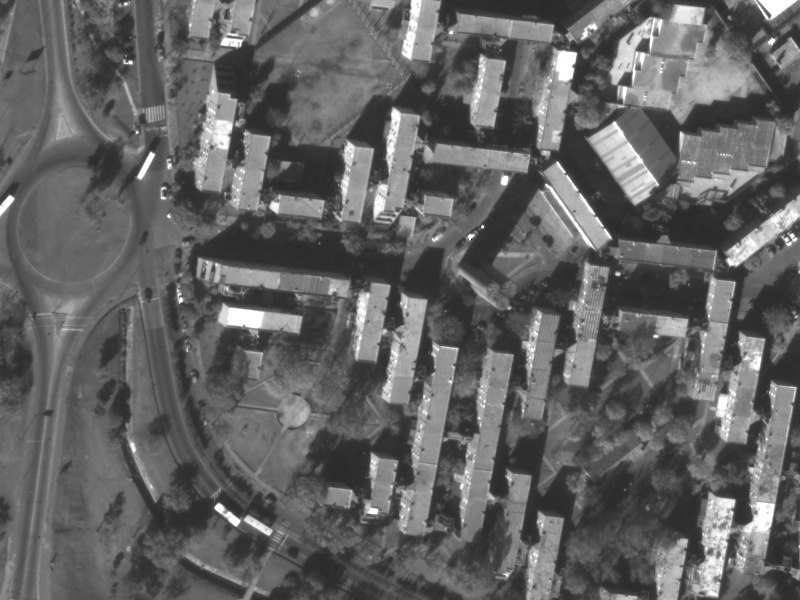
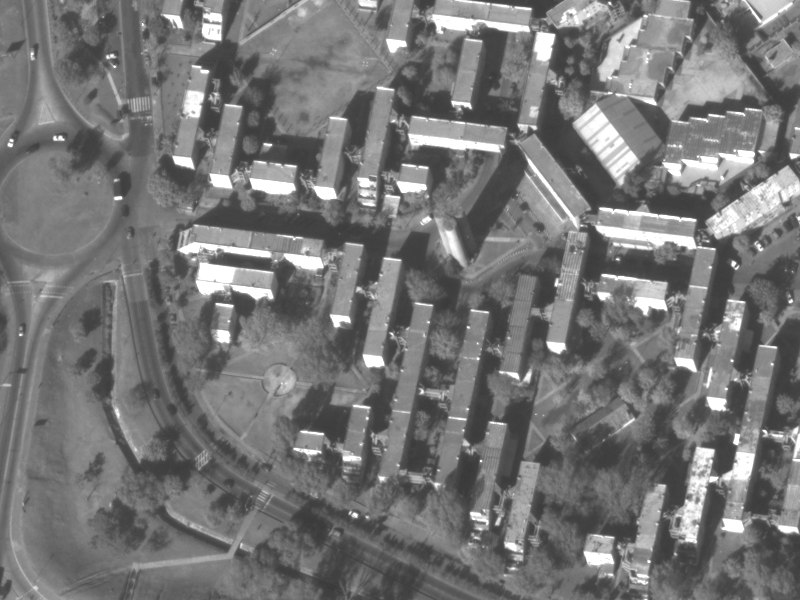
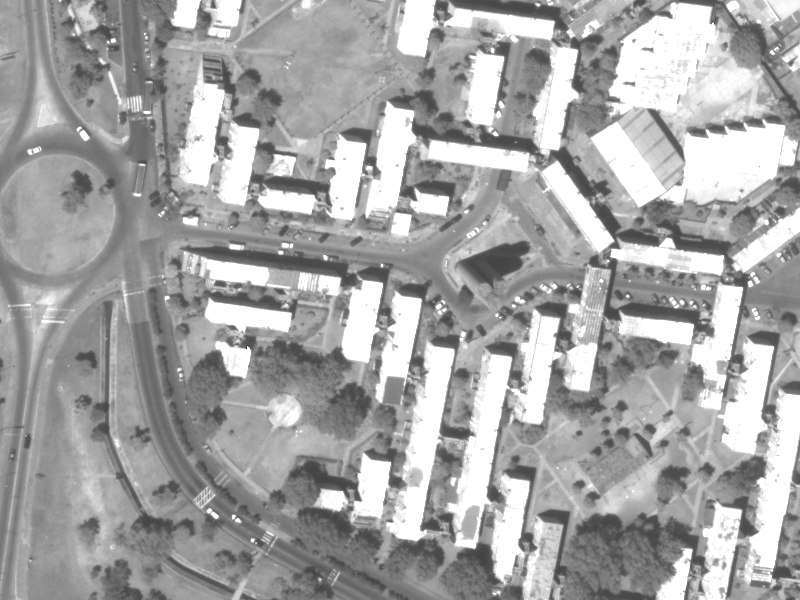
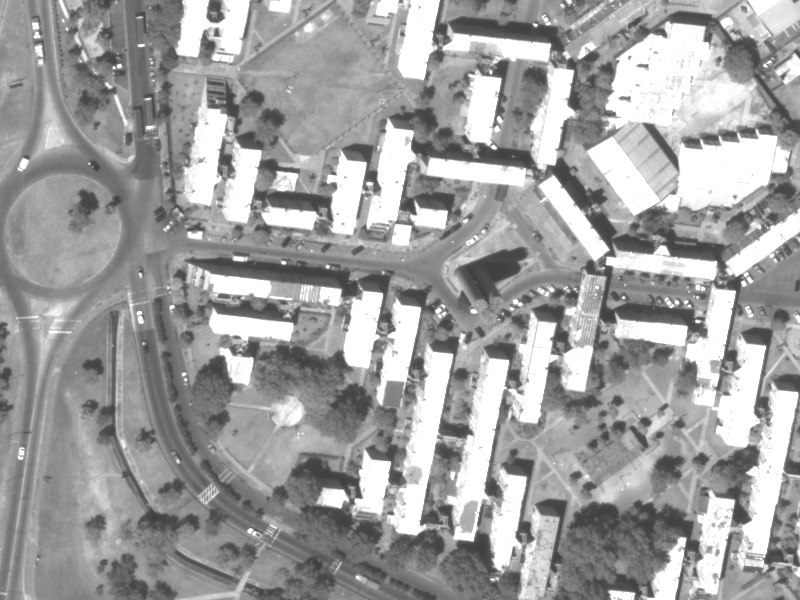
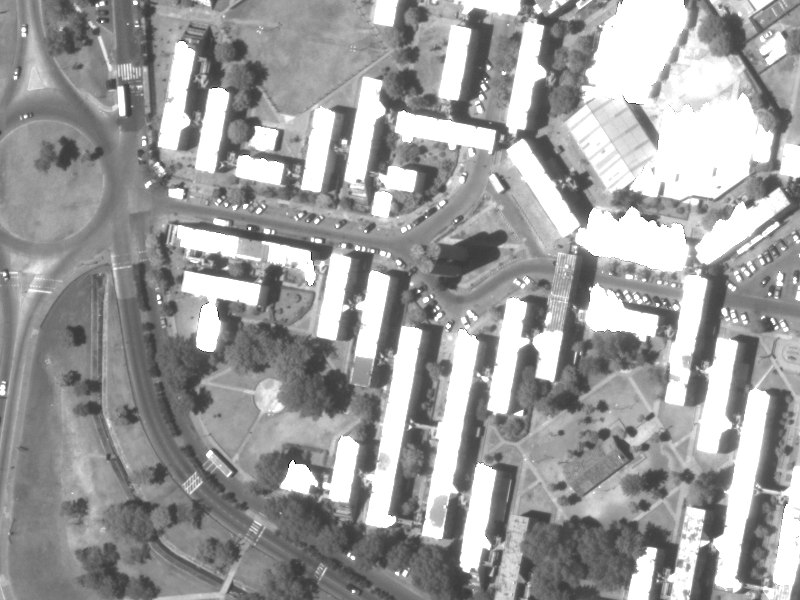
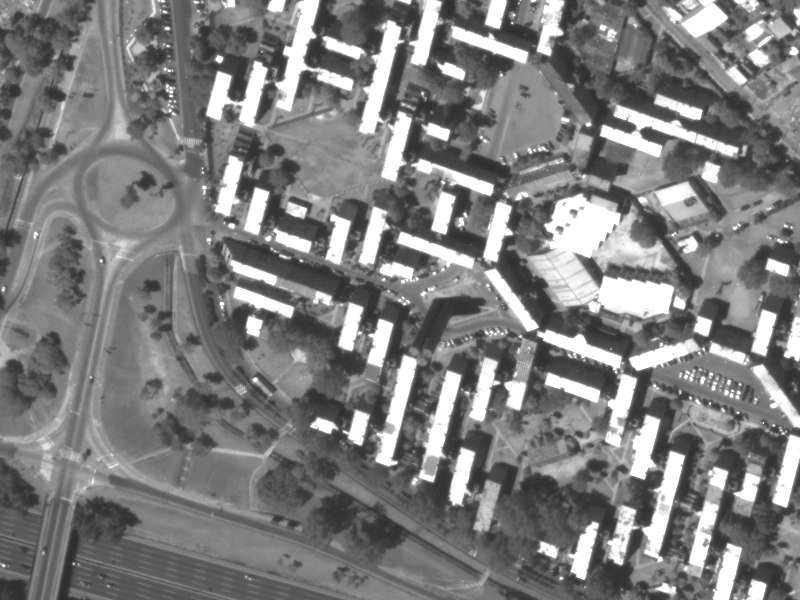
The training site has low-rise buildings arranged in octagonal patterns, and a high water tower formed by three cylinders. In the IARPA challenge, this site was used for the explorer (preliminary) contest and latest as training for the final contest.
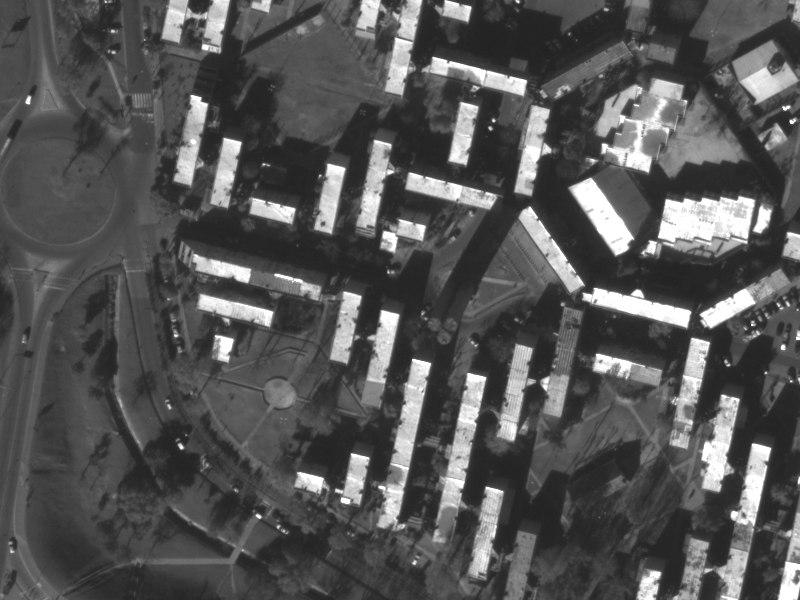
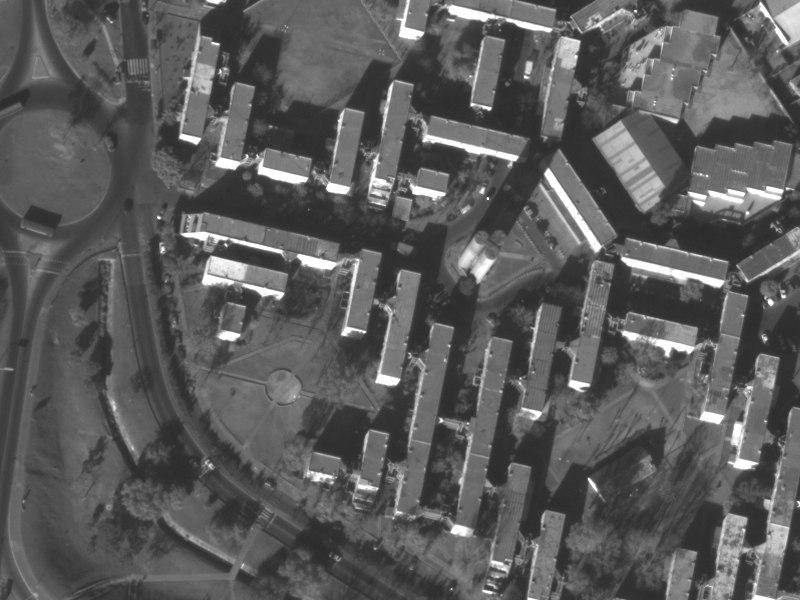
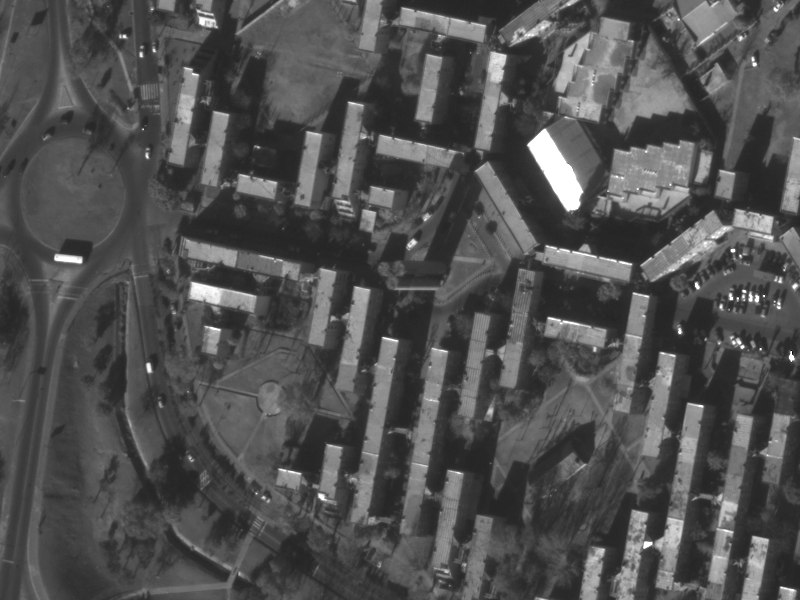
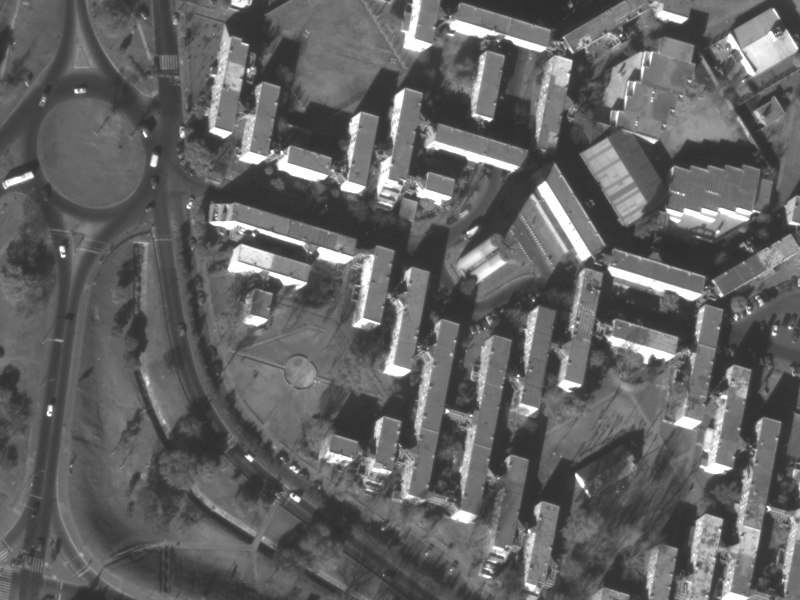
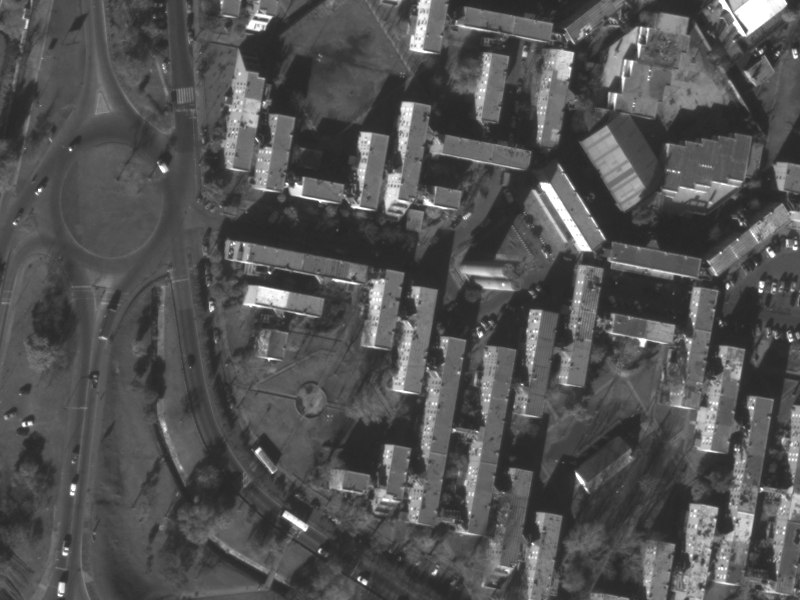
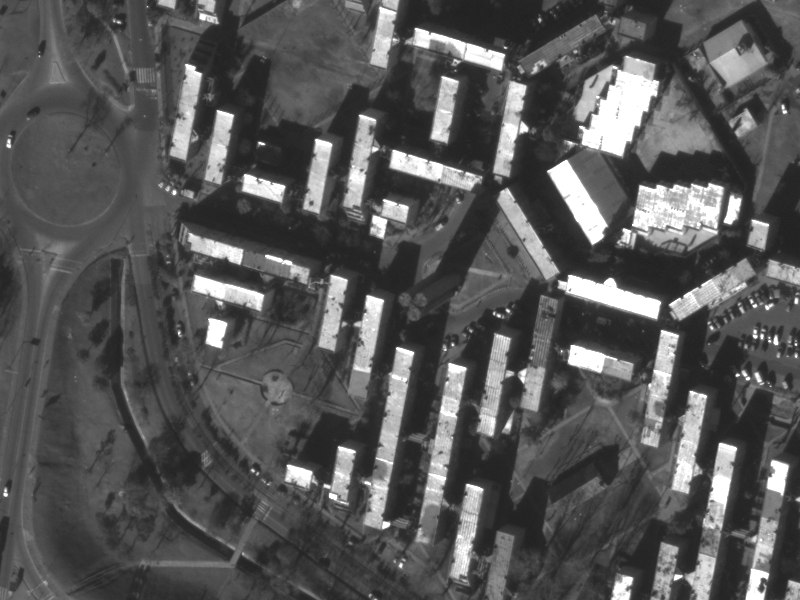
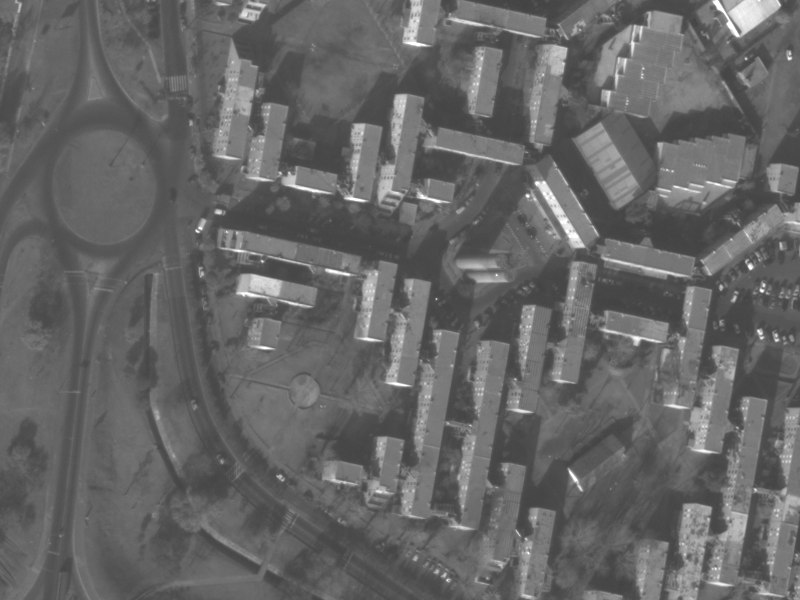
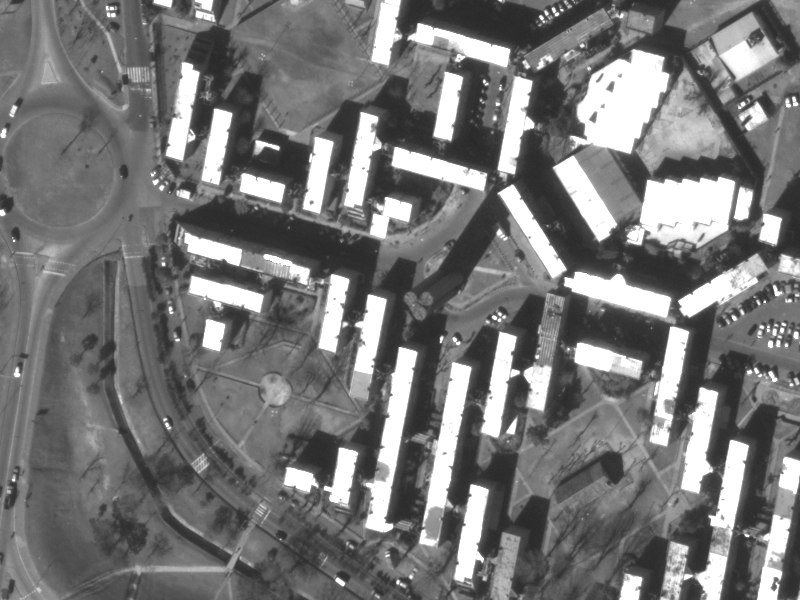
The following gallery shows the 47 input images cropped at size 800x600 around the center of the water tower. Notice that the orientation and the ground resolution of each image is different, due to the arbitrary acquisition directions. Notice also that the dynamic range of each image is different, due to the seasons and to the cirrus cover.
Training site crop

Results
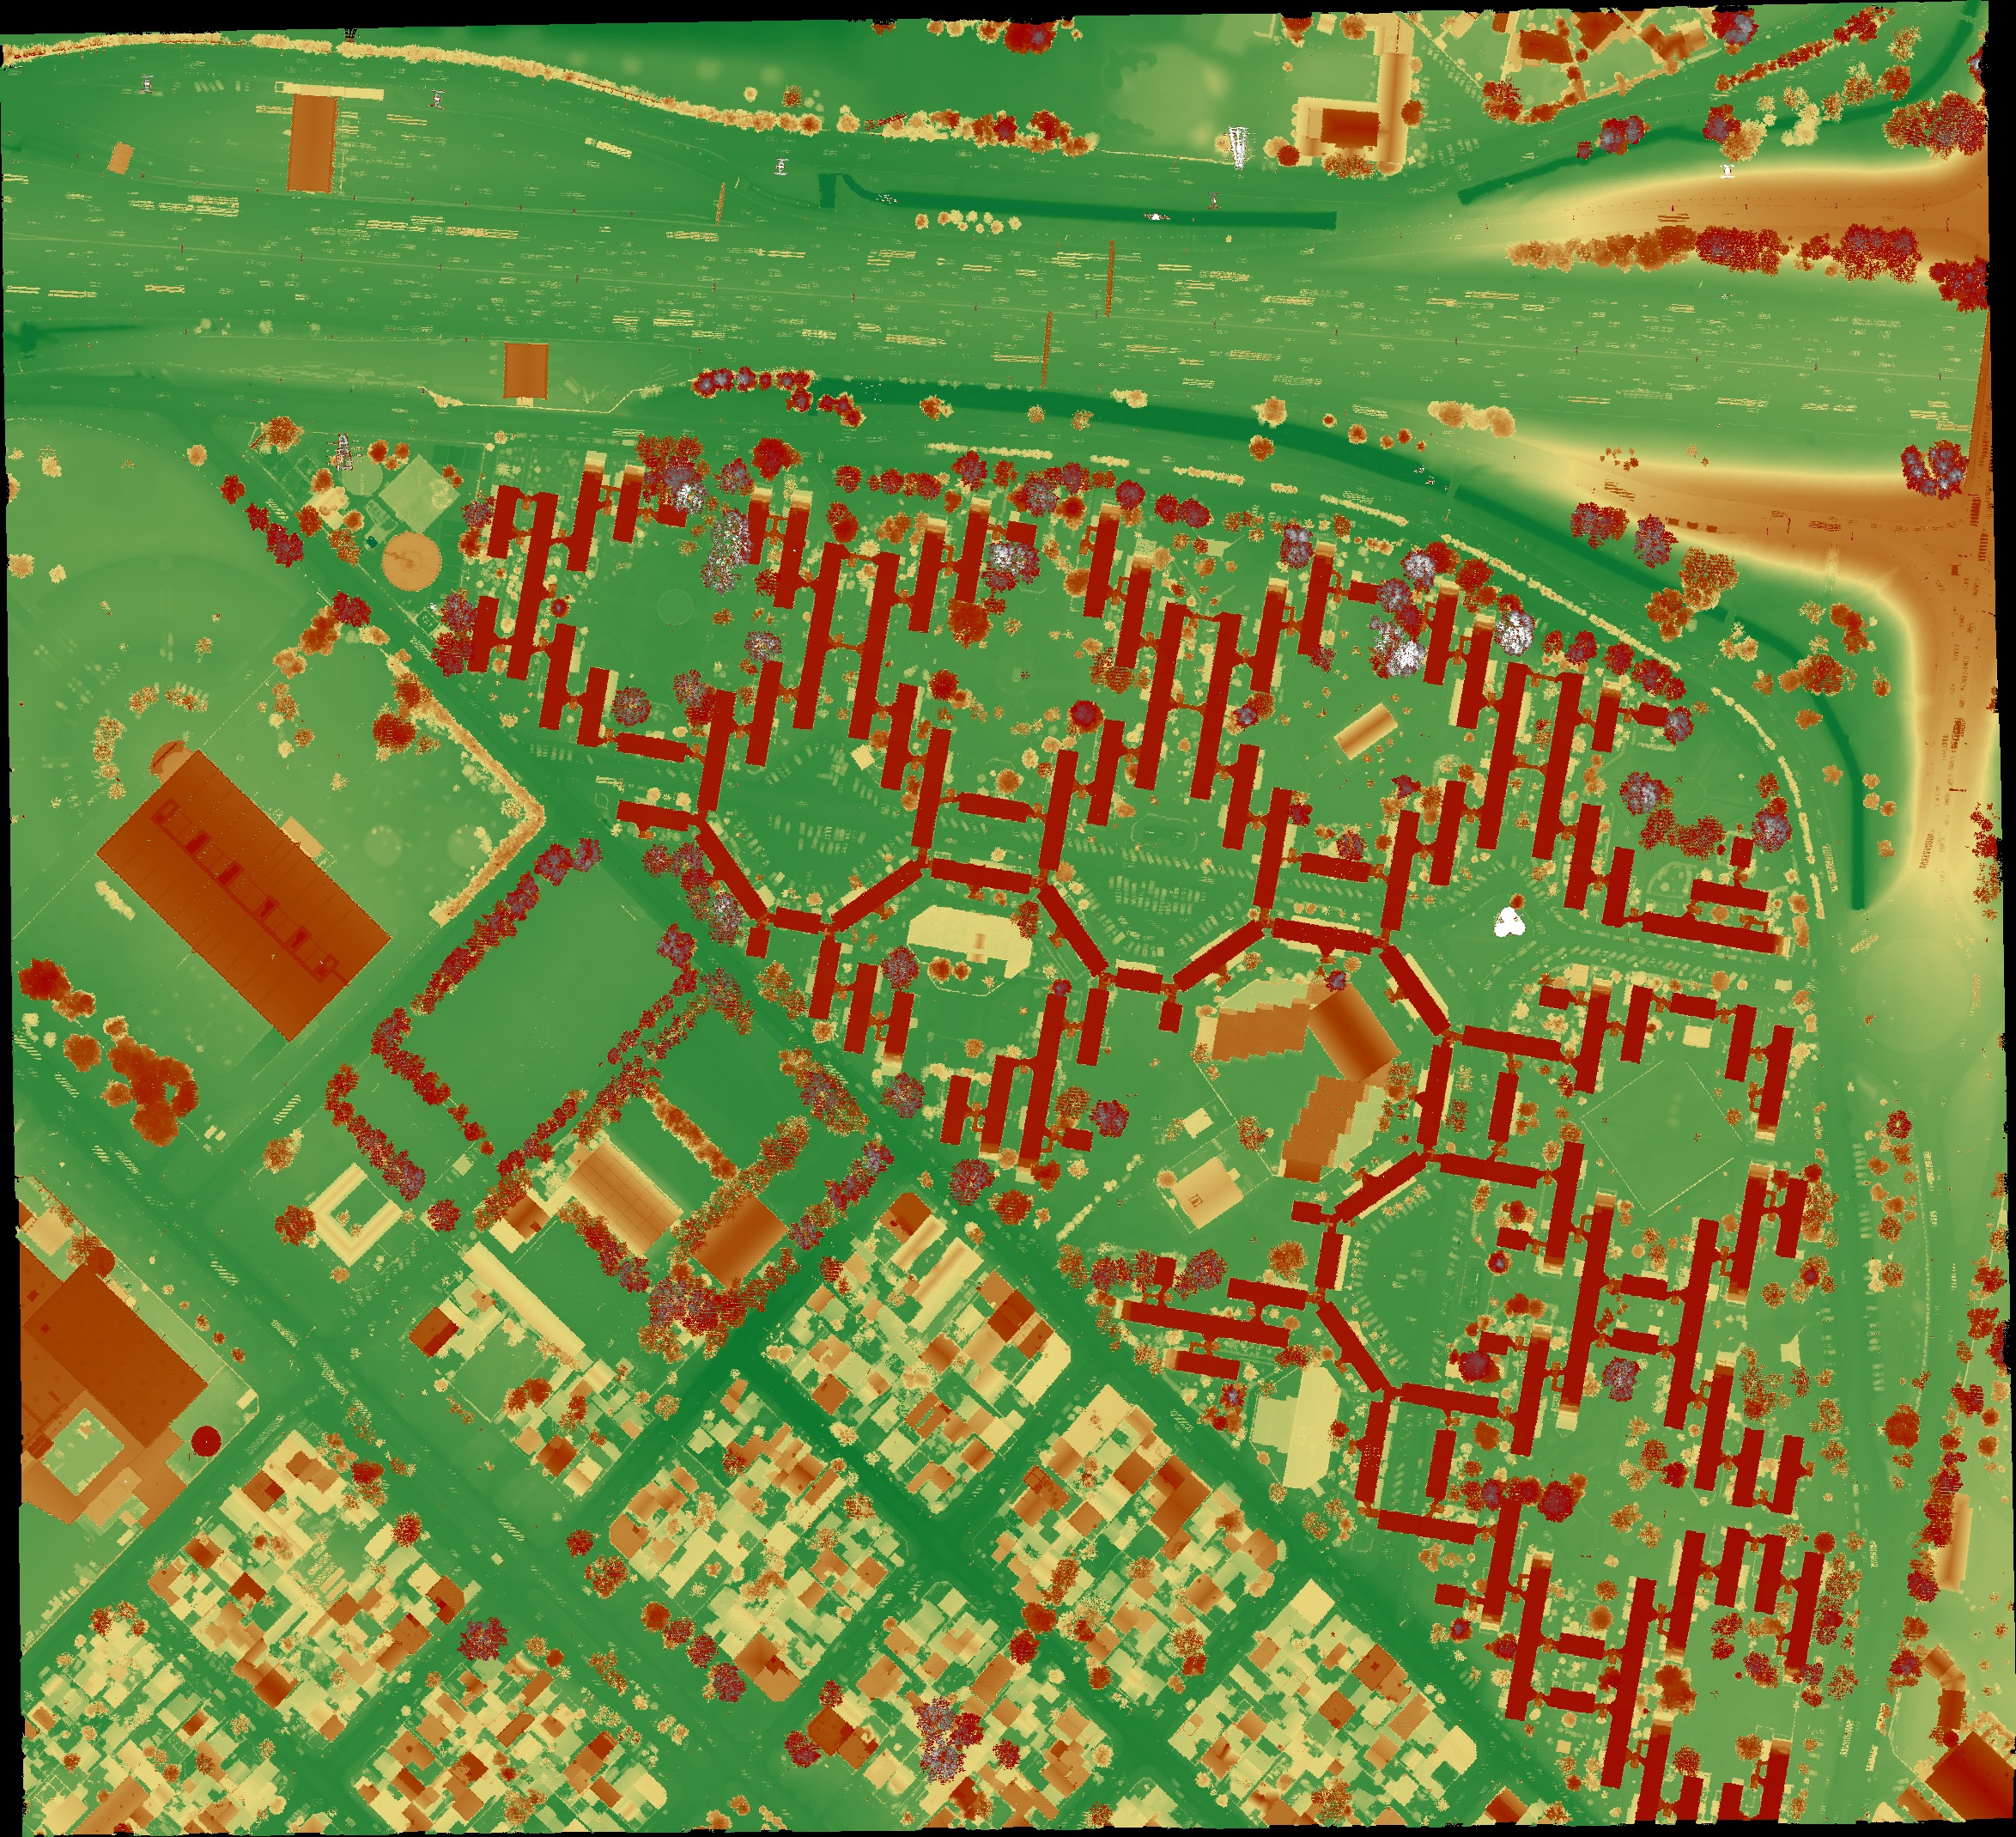
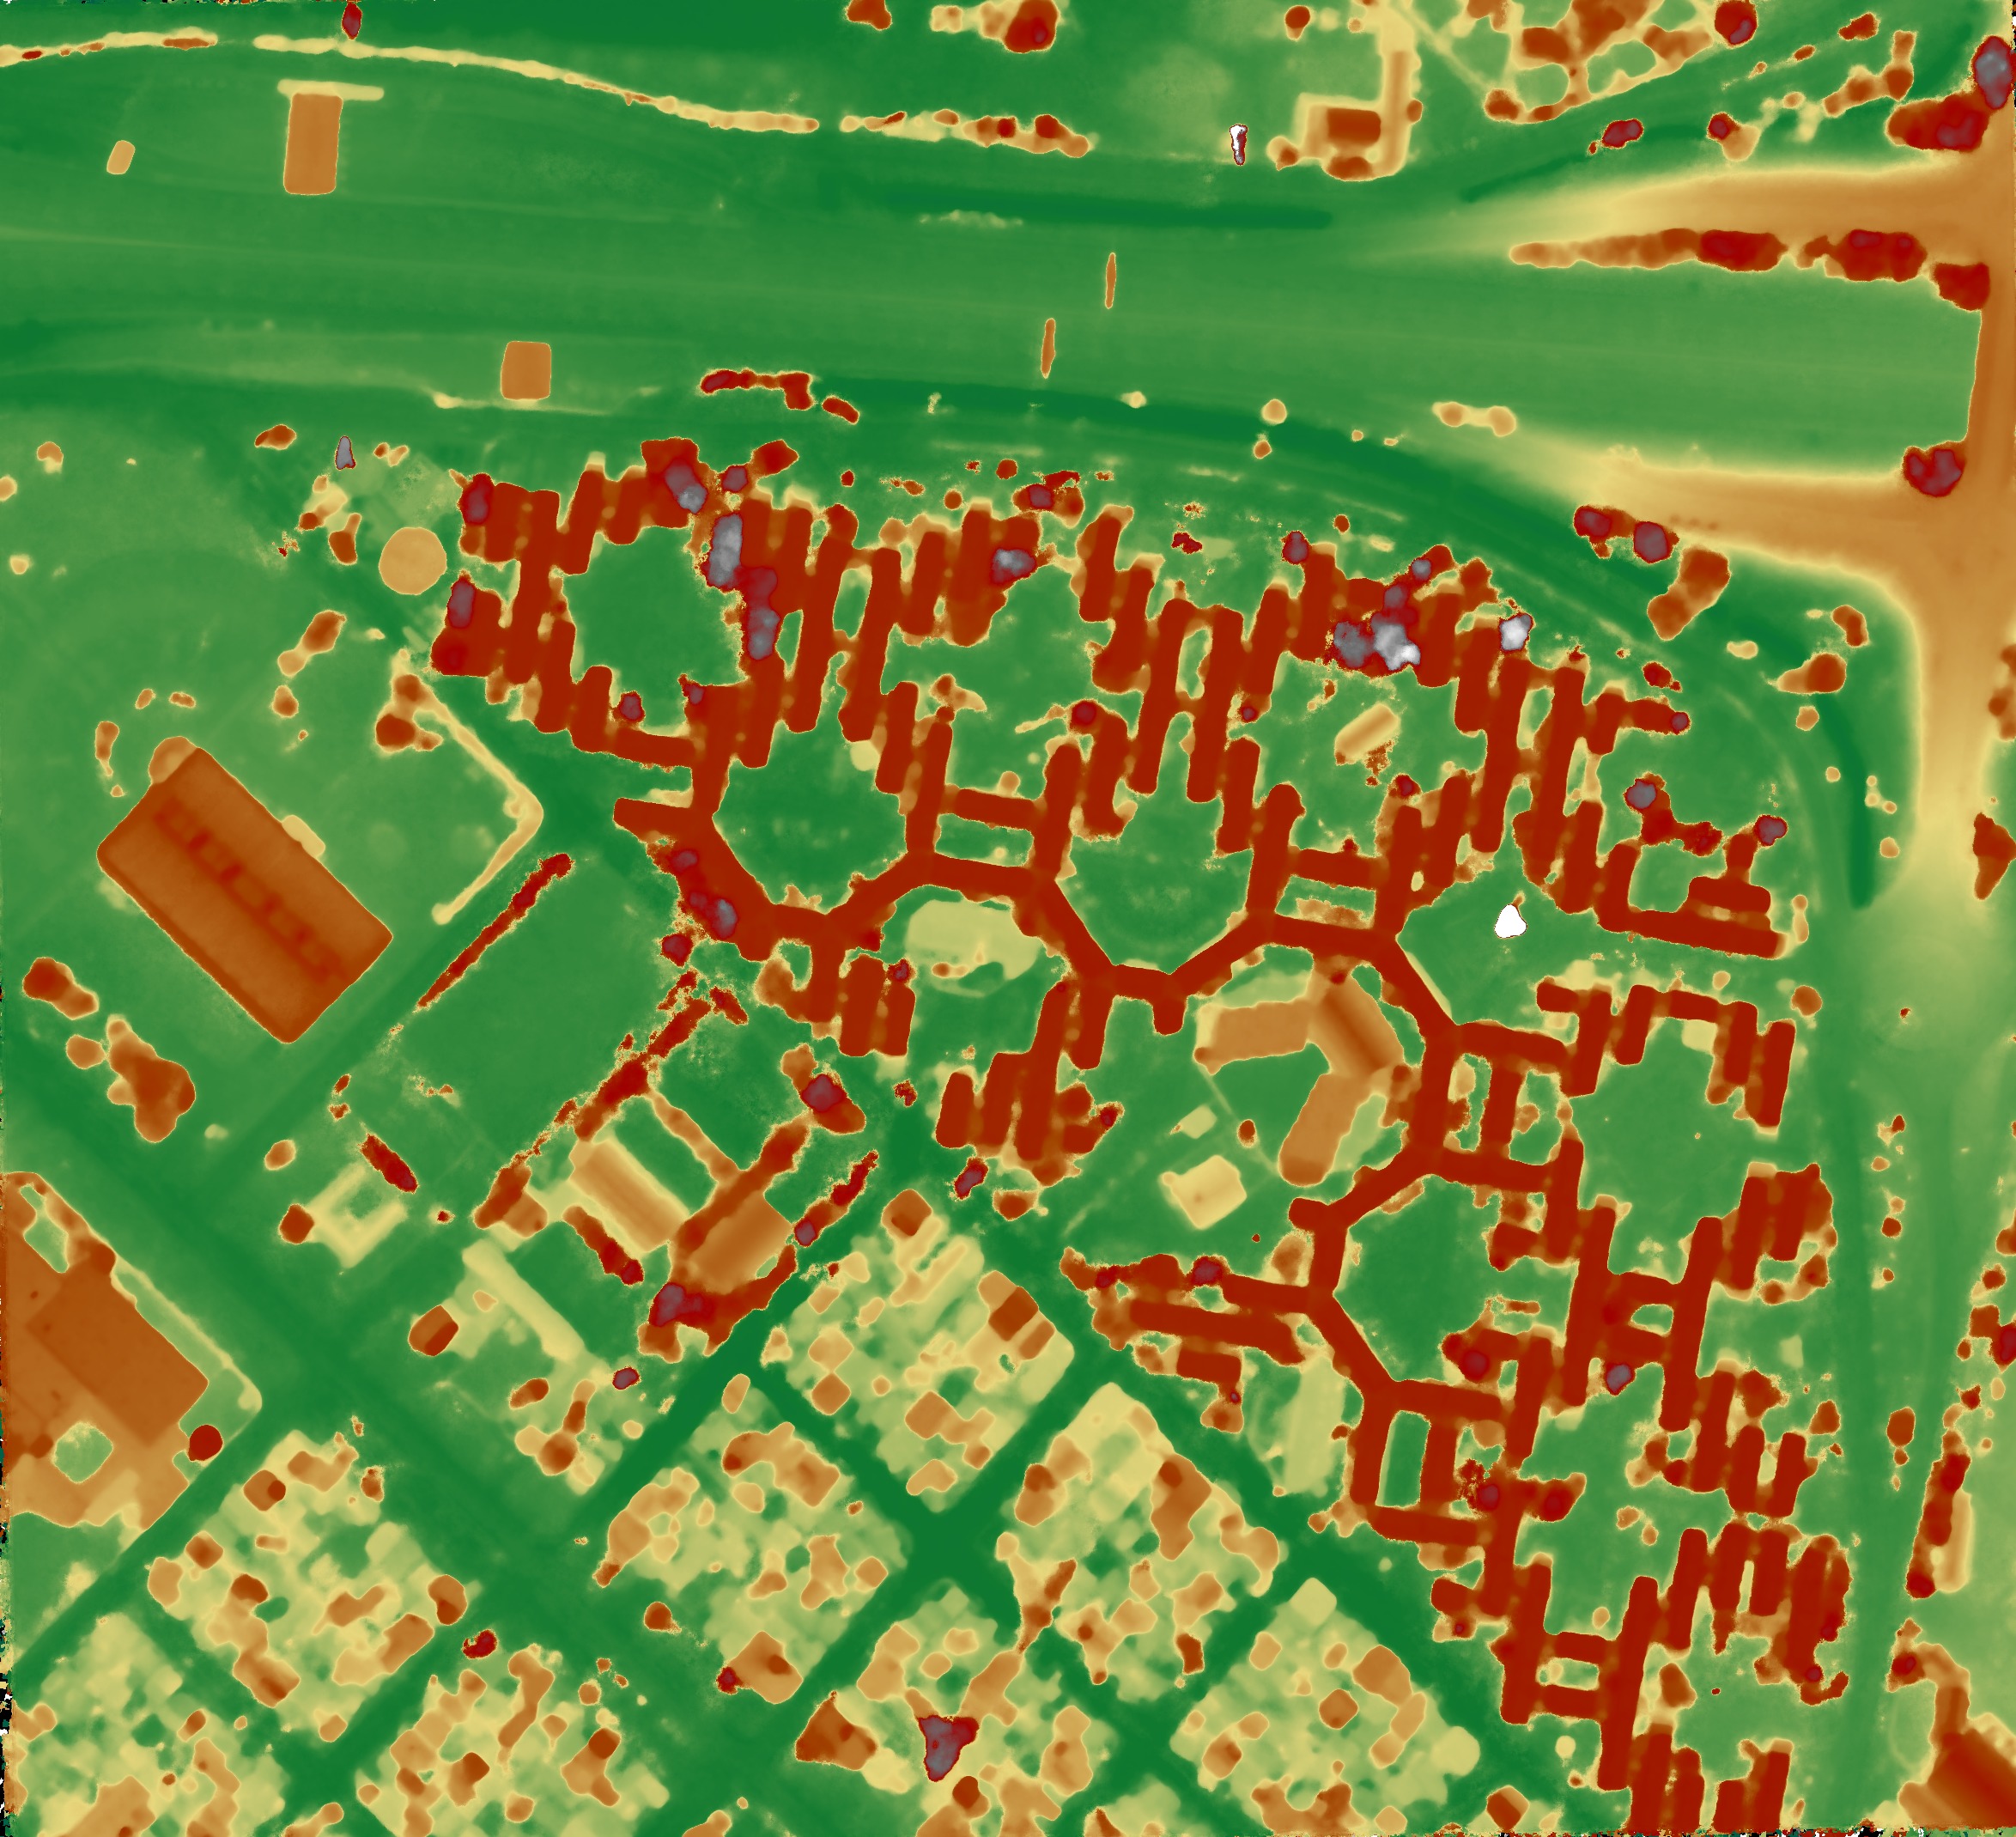
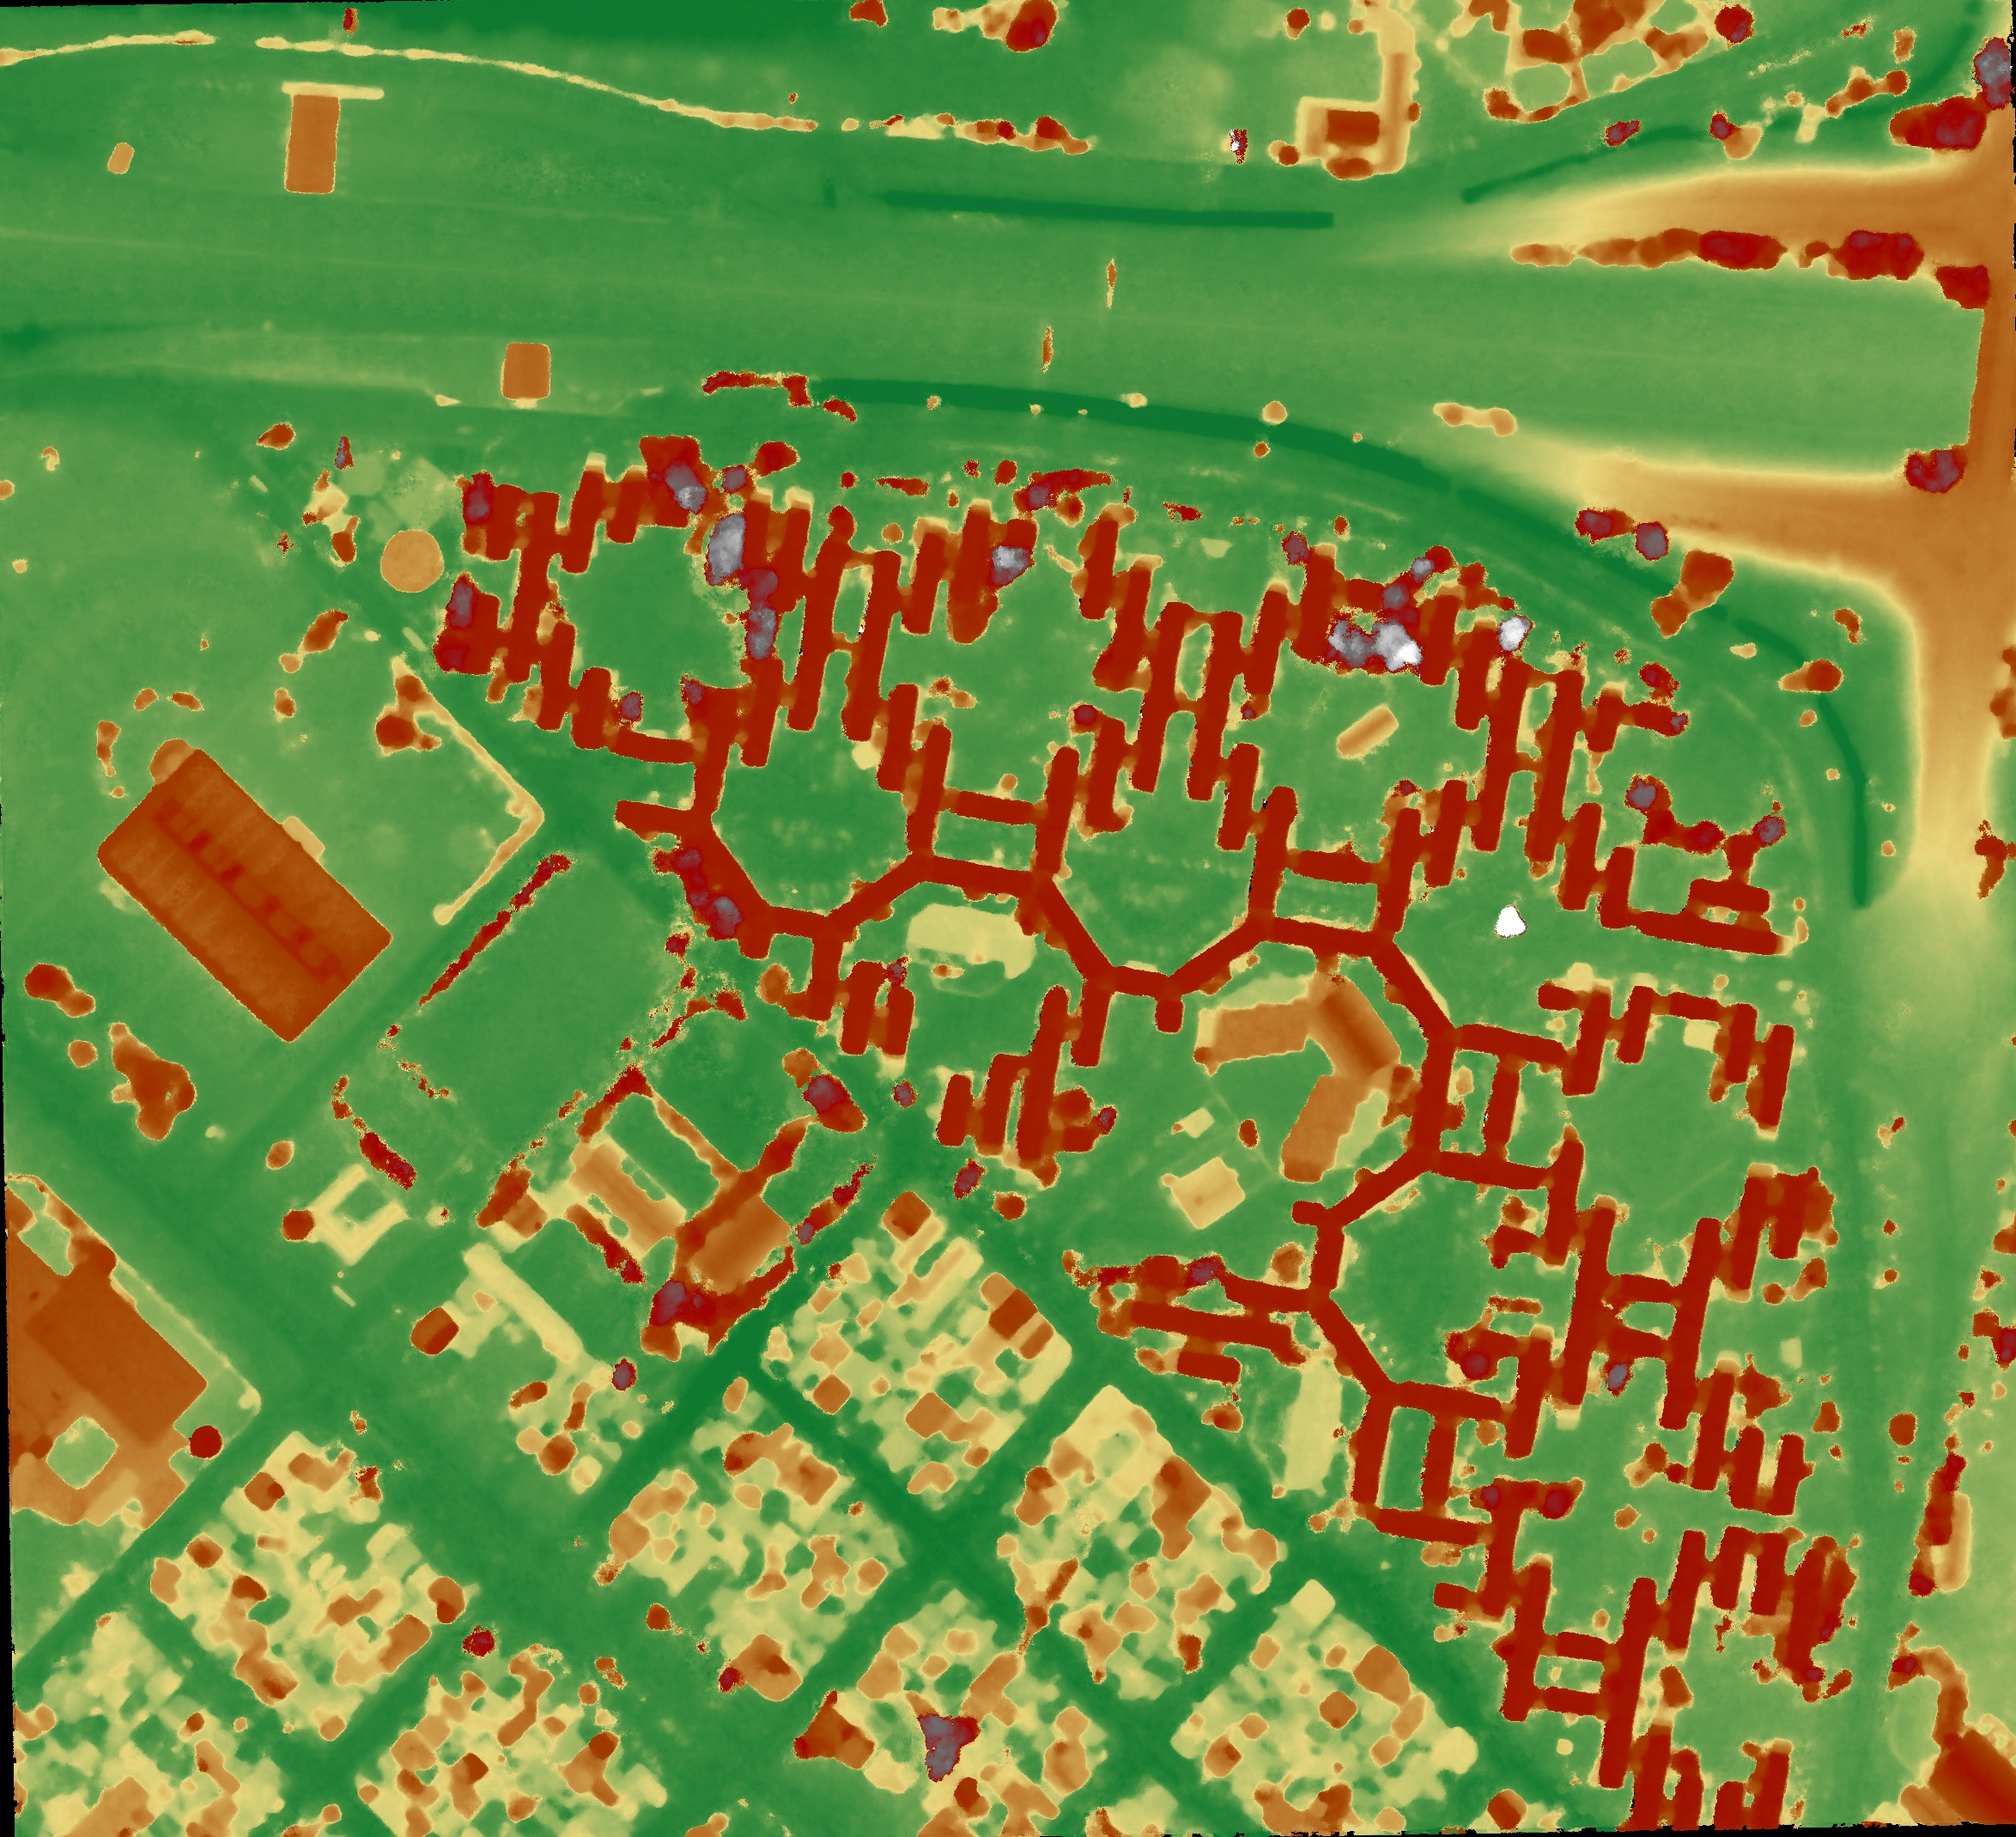
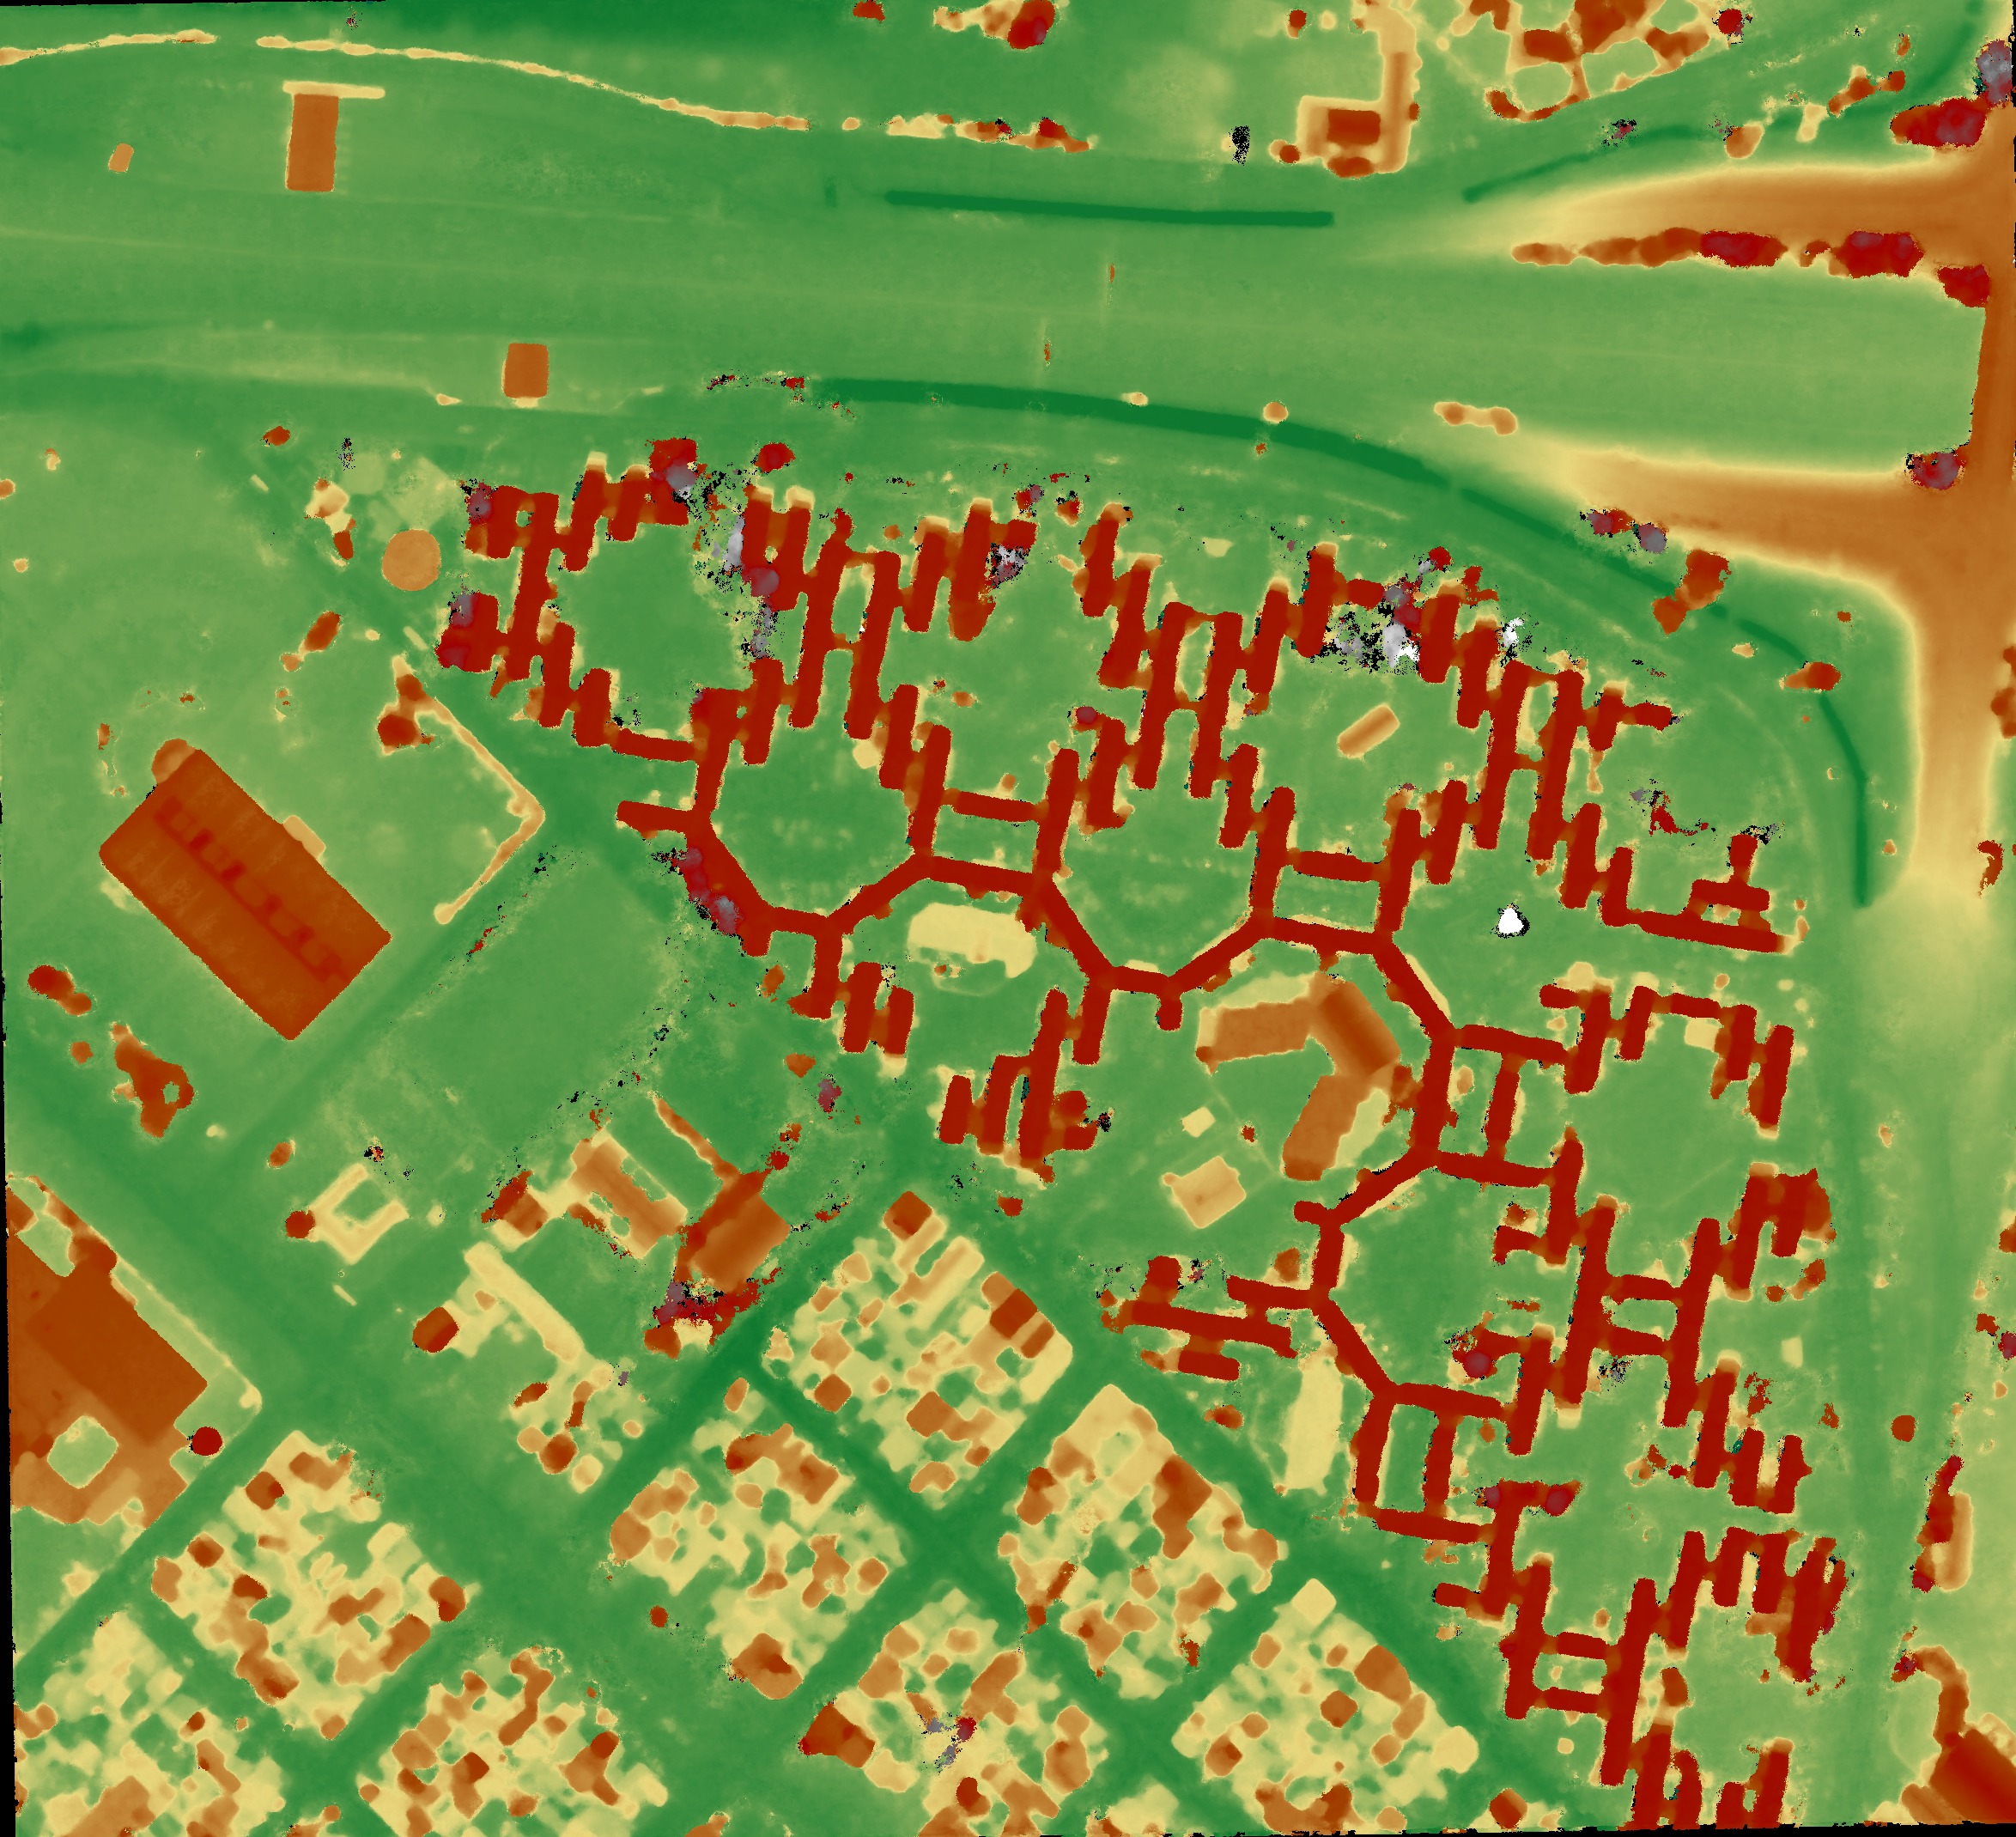
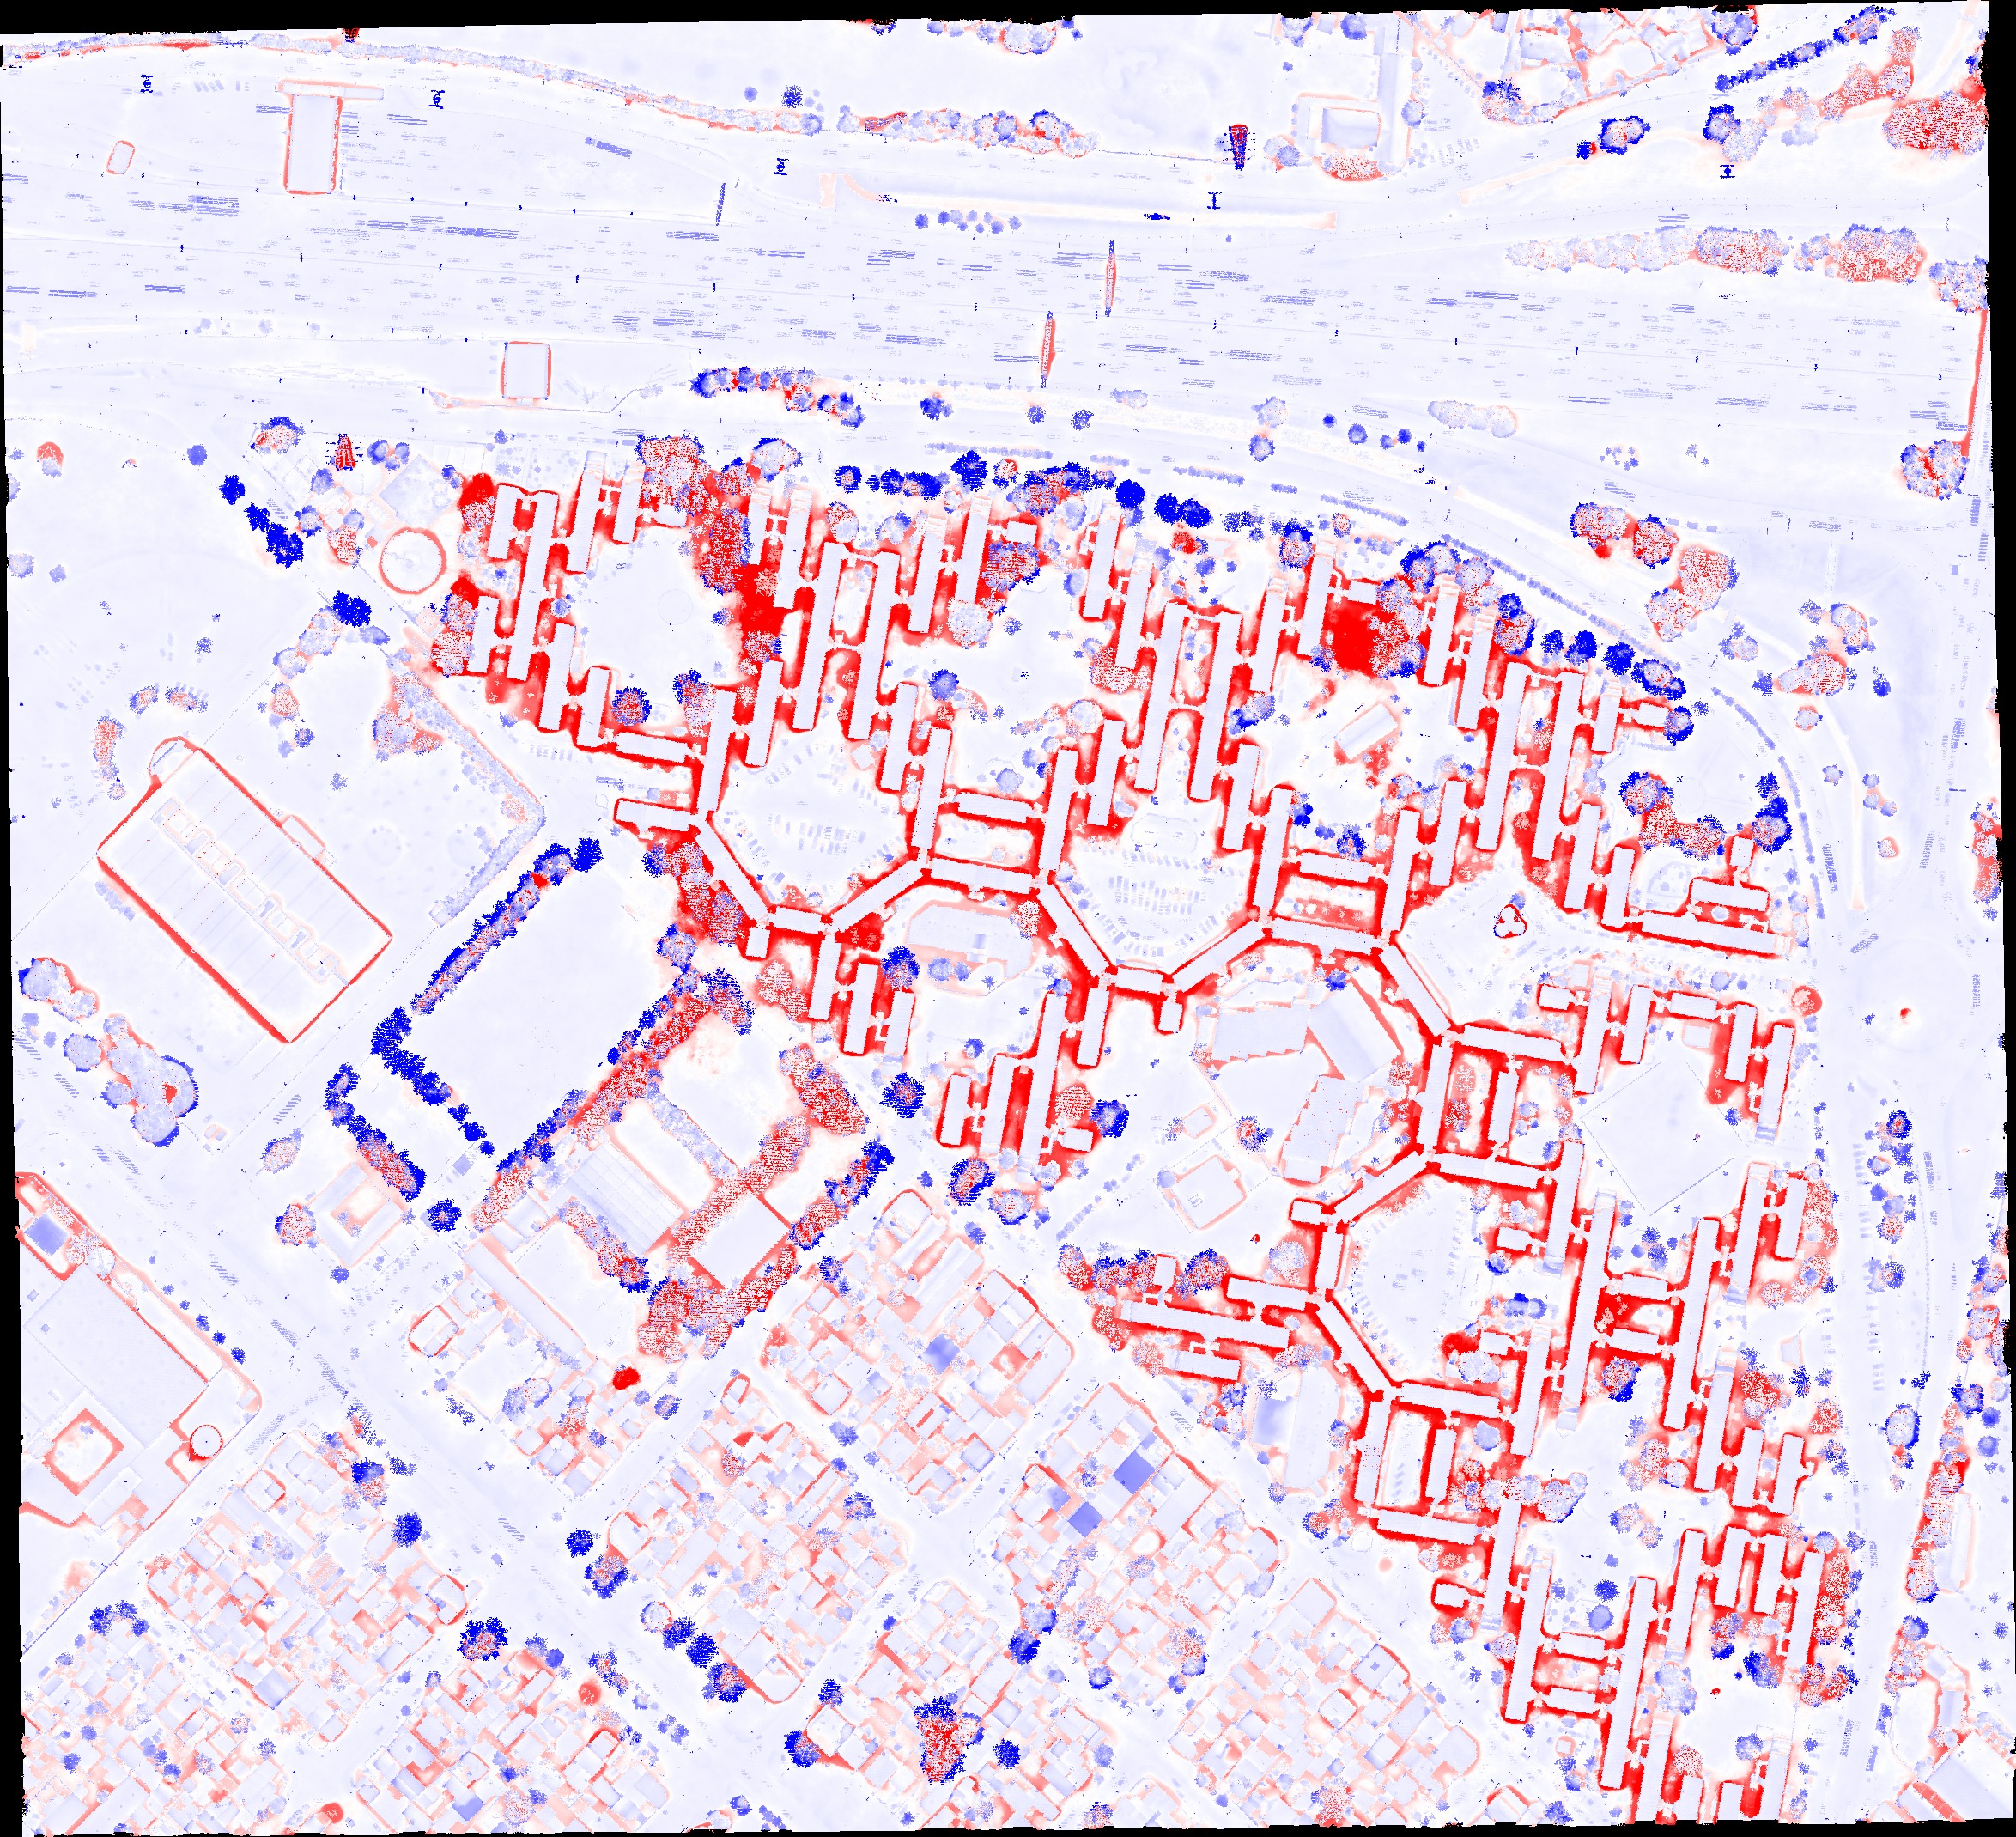
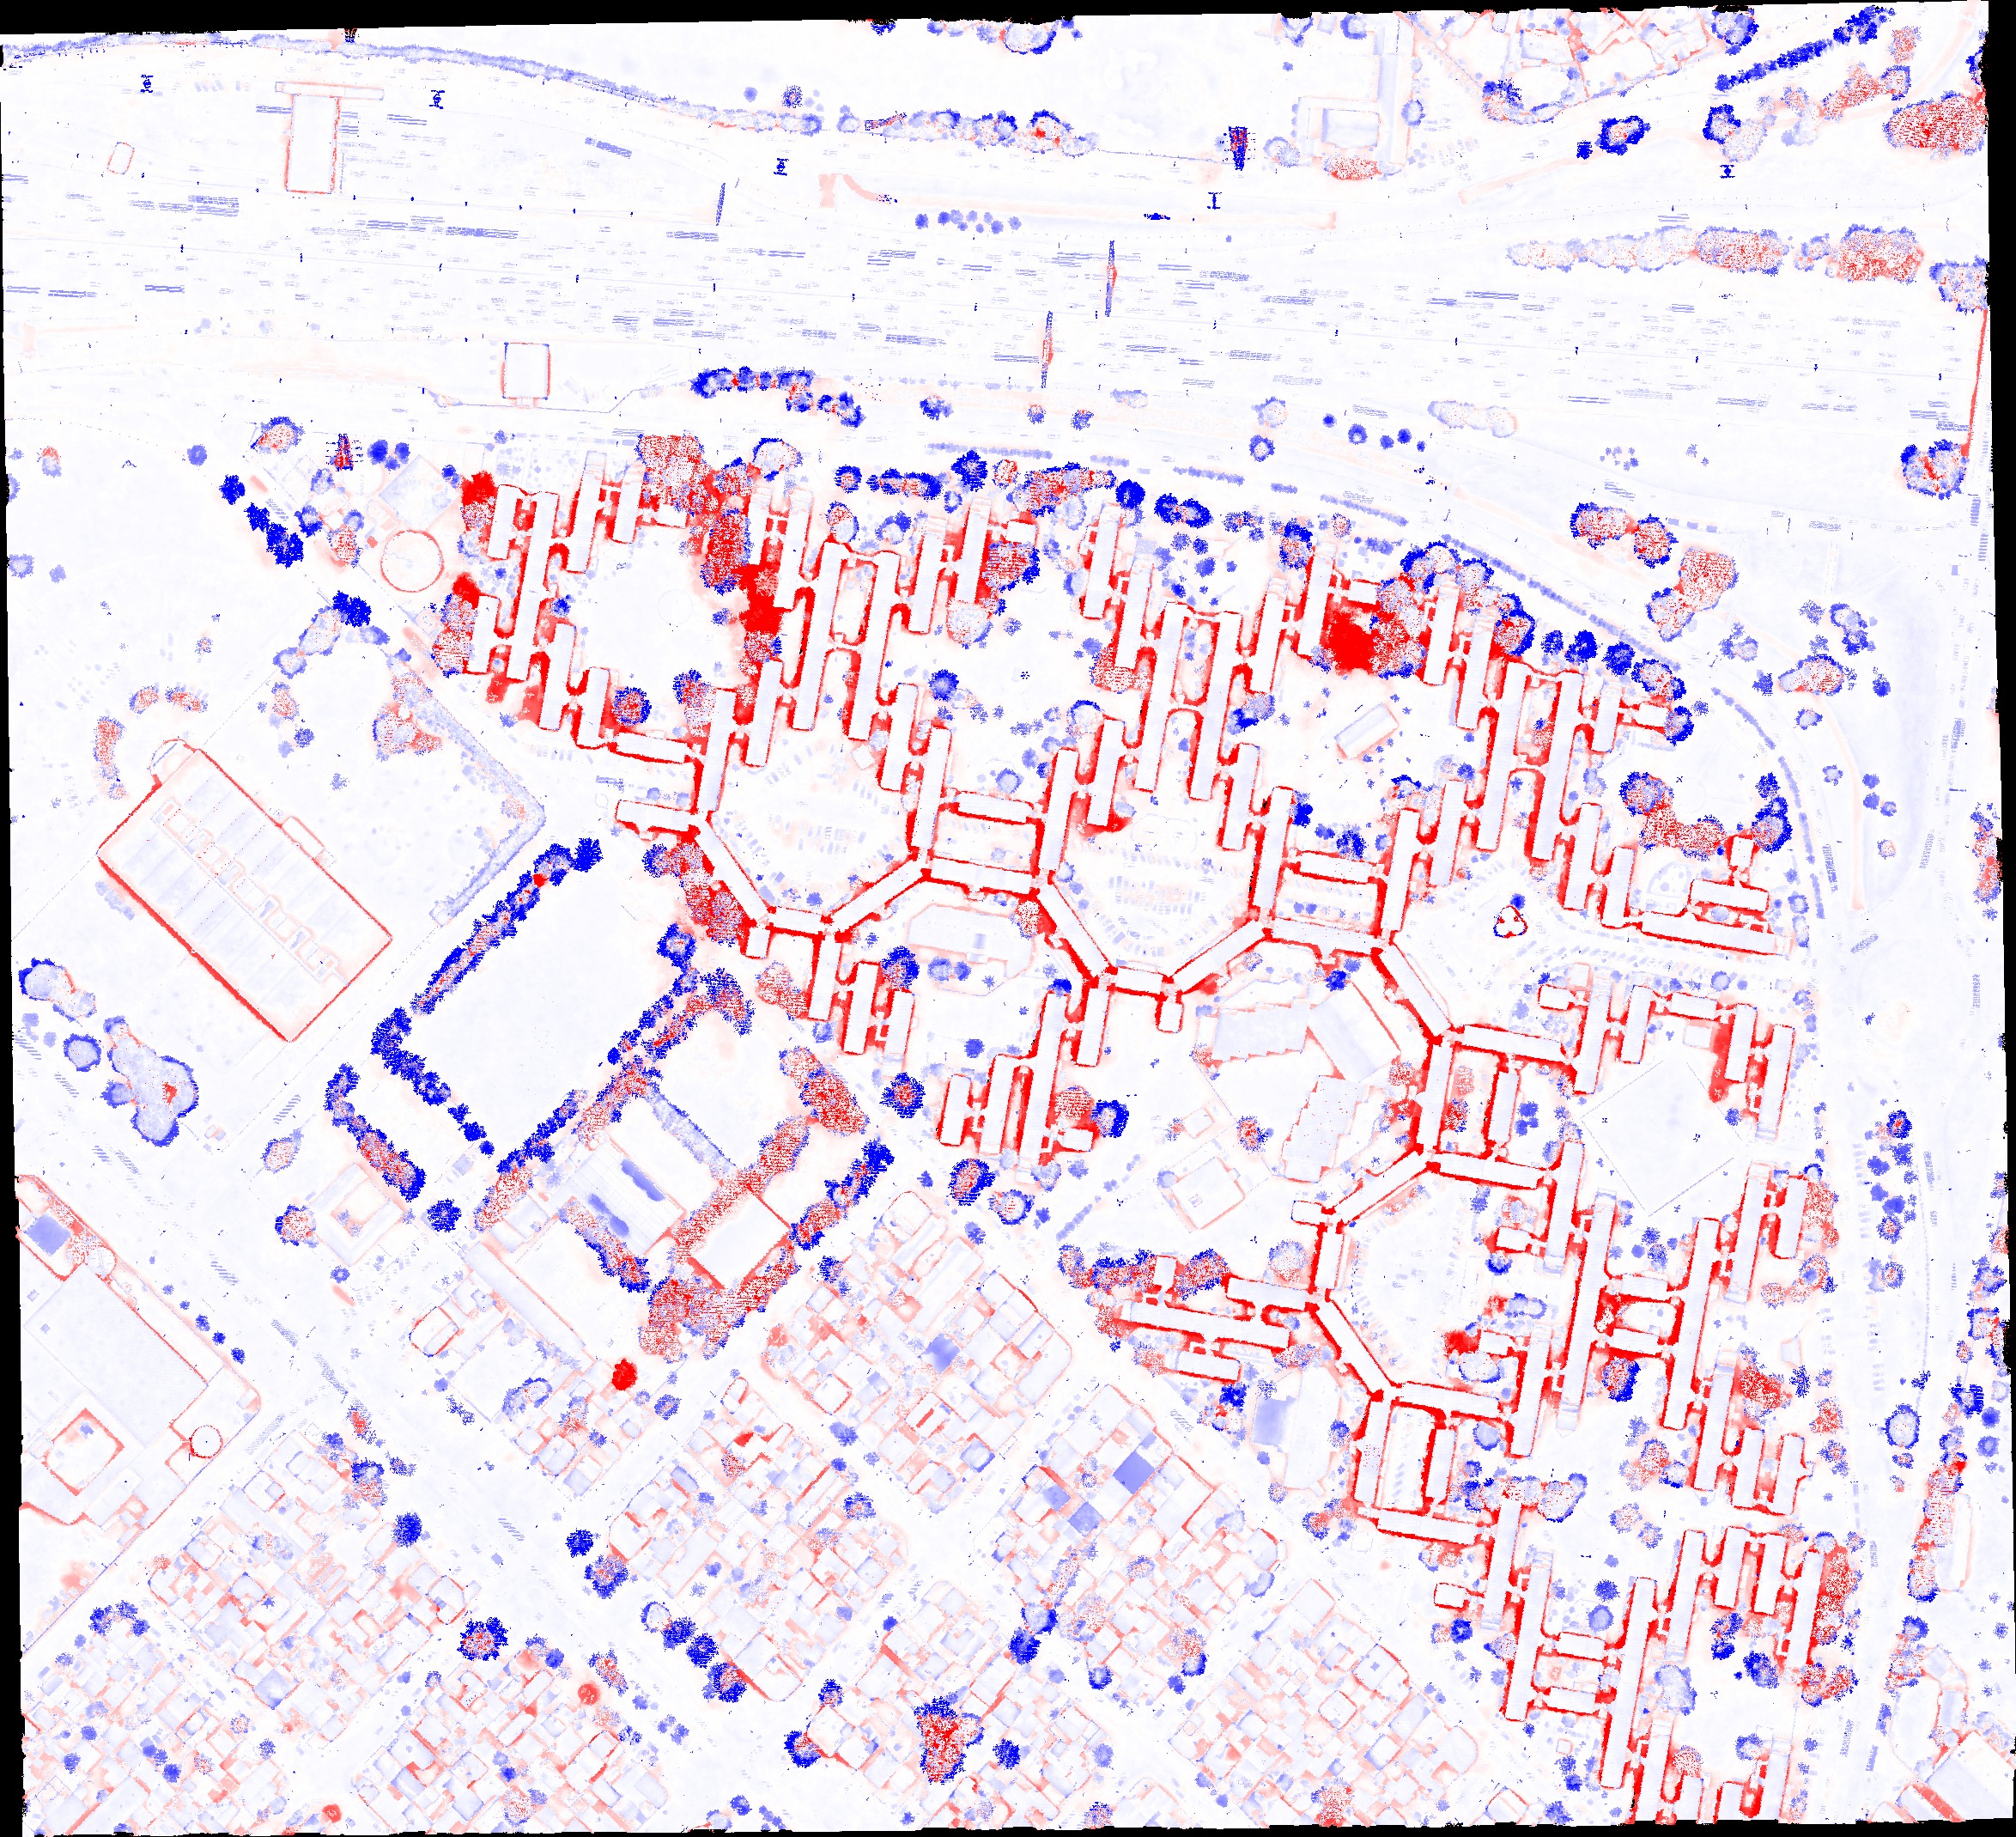
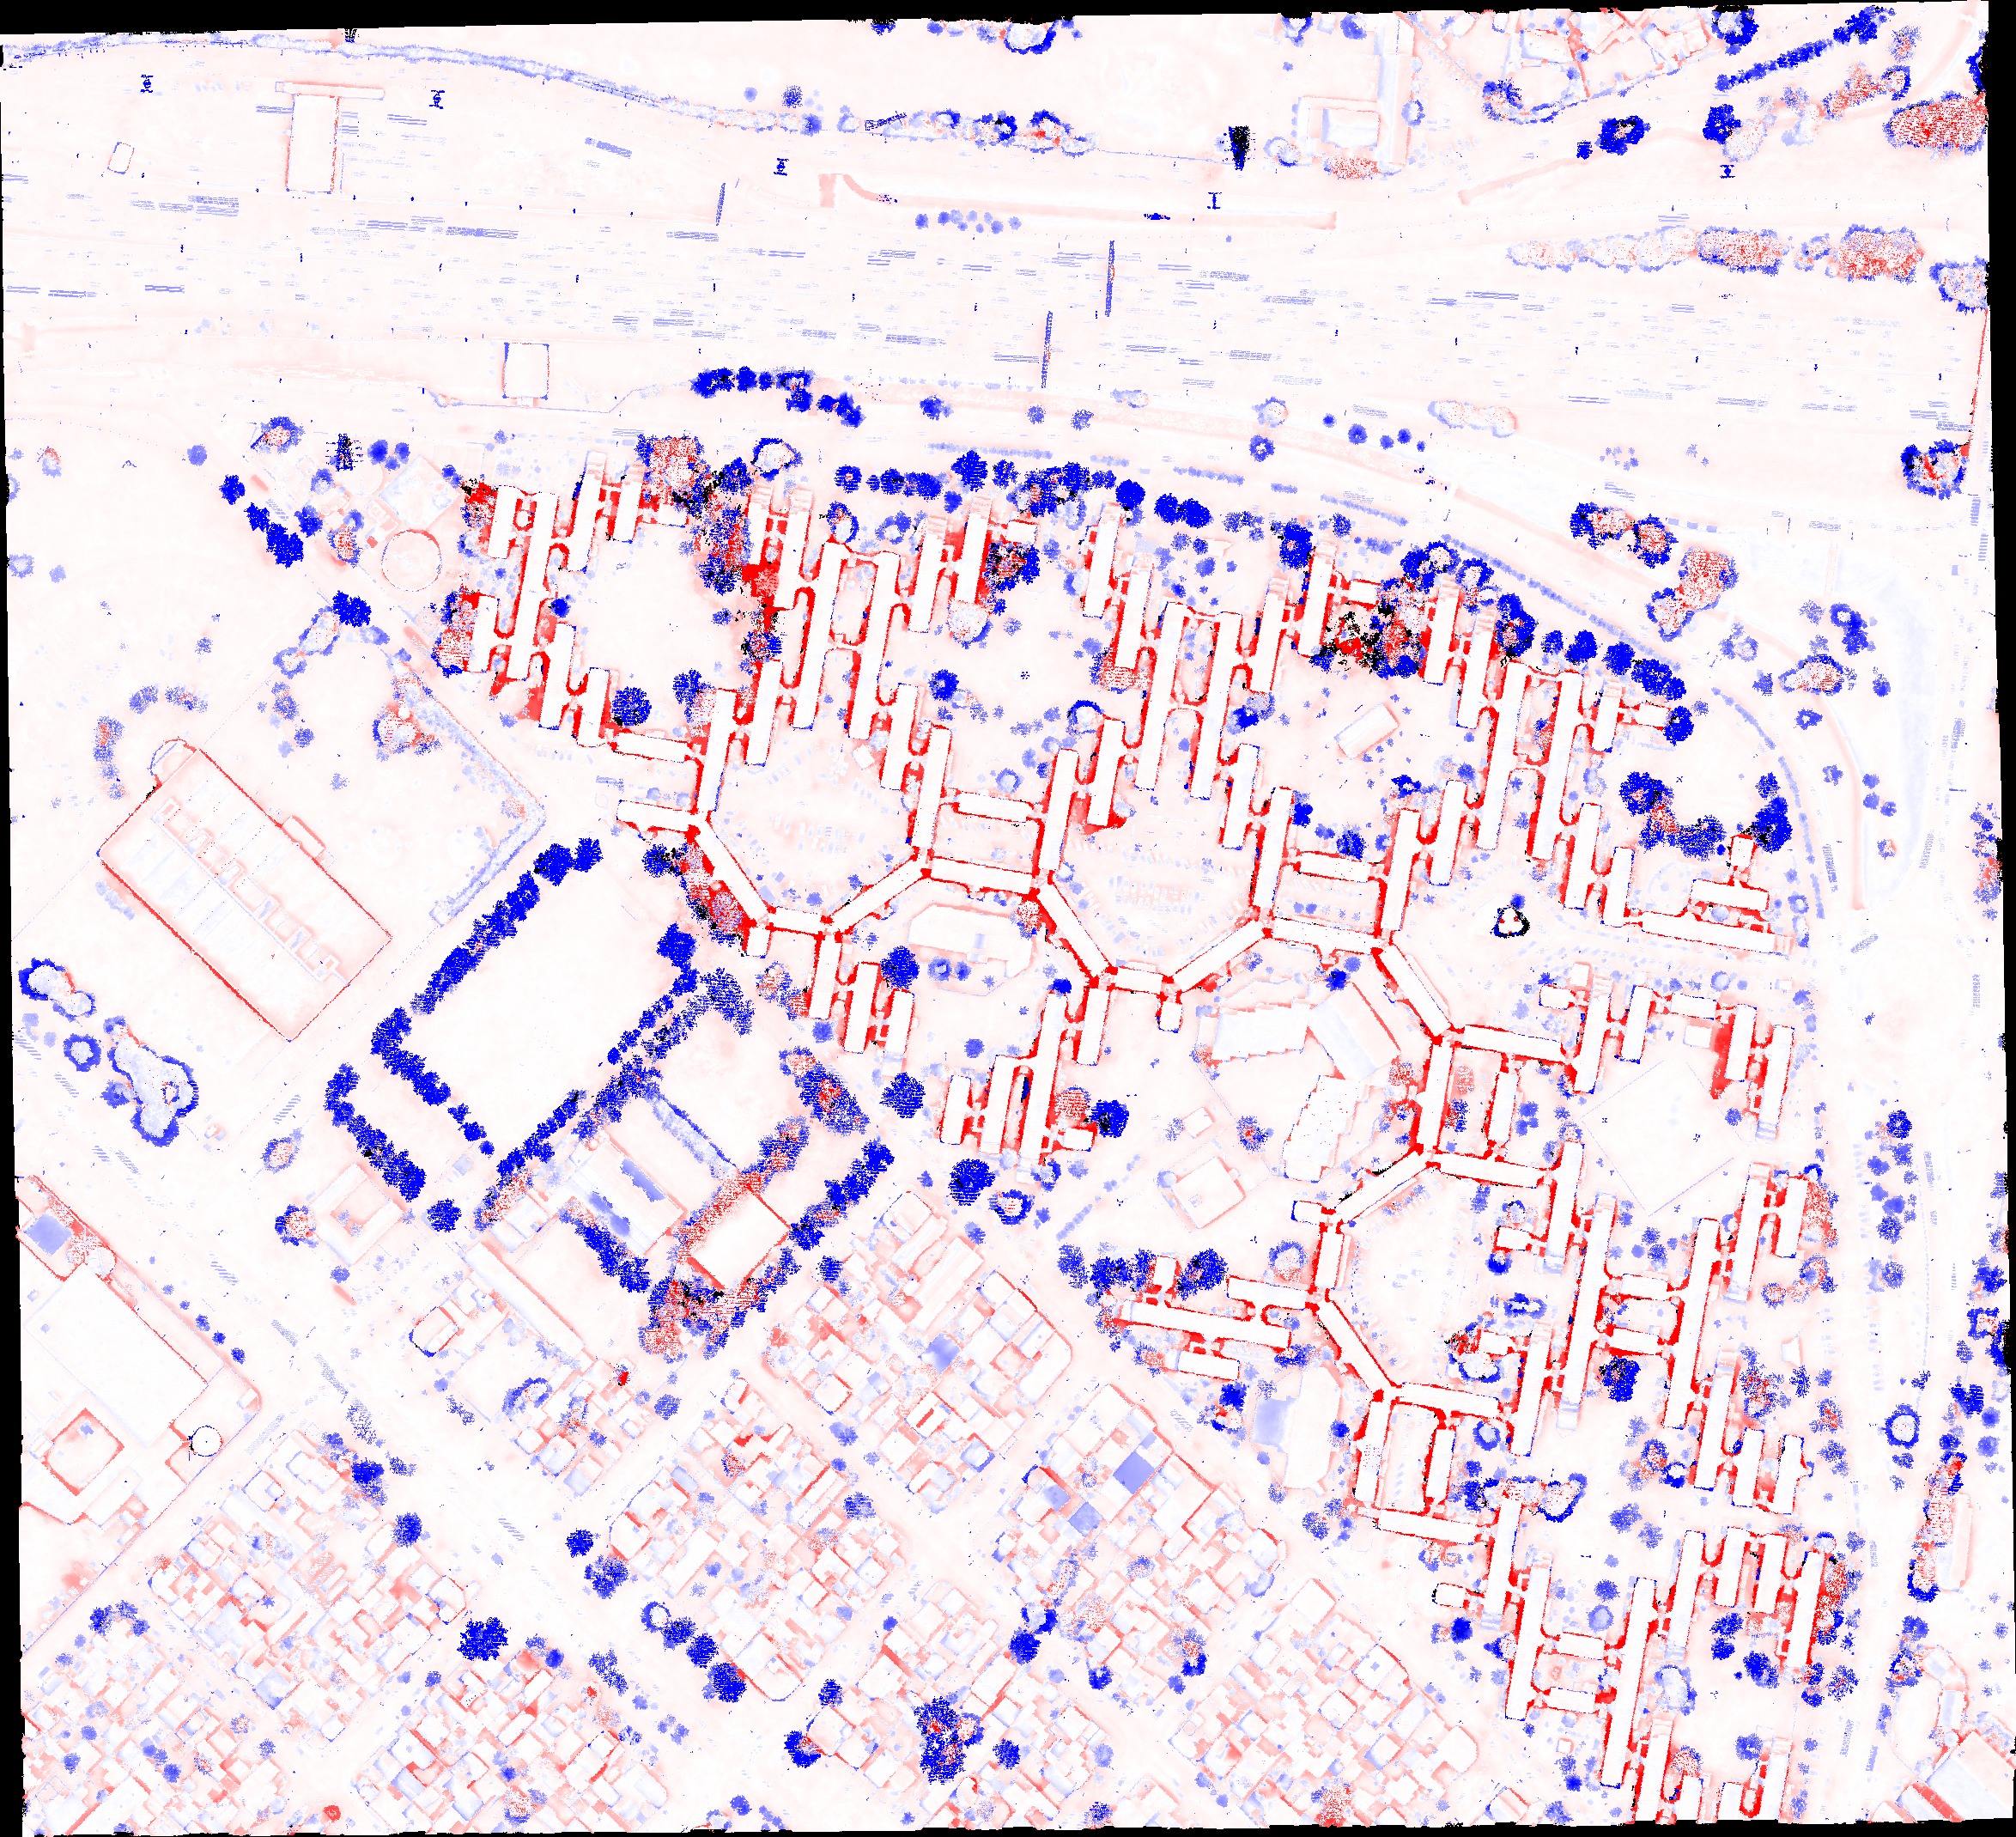
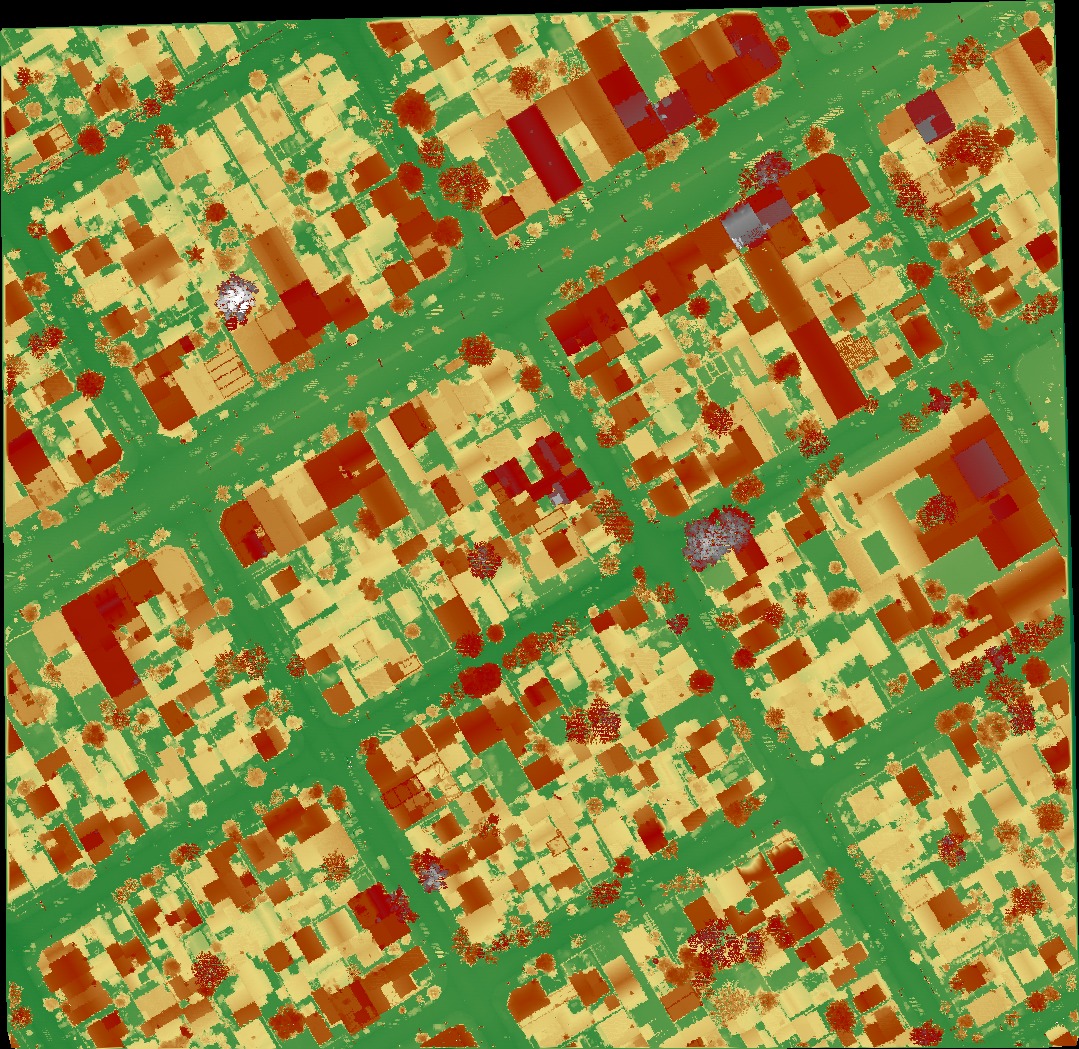
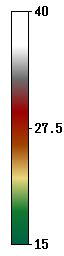
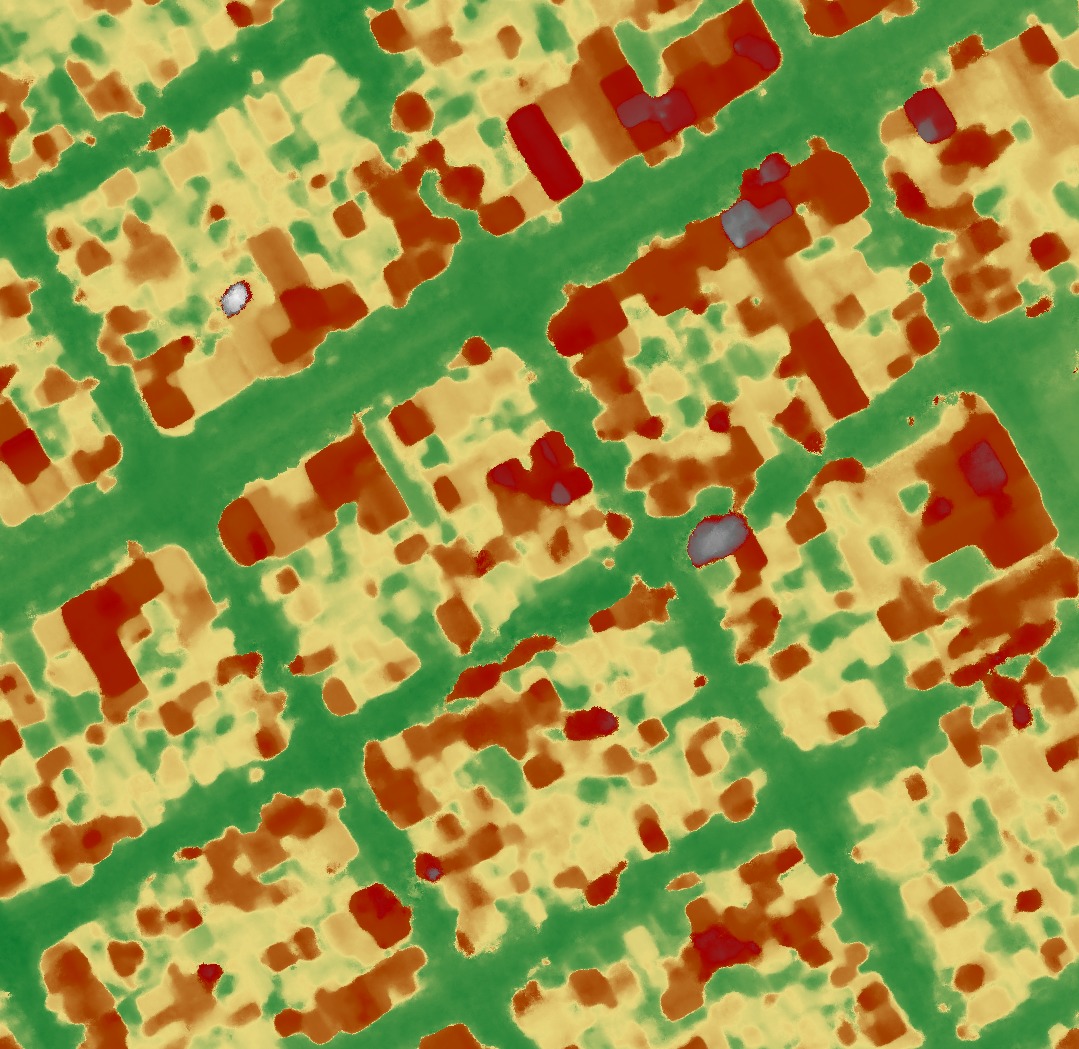
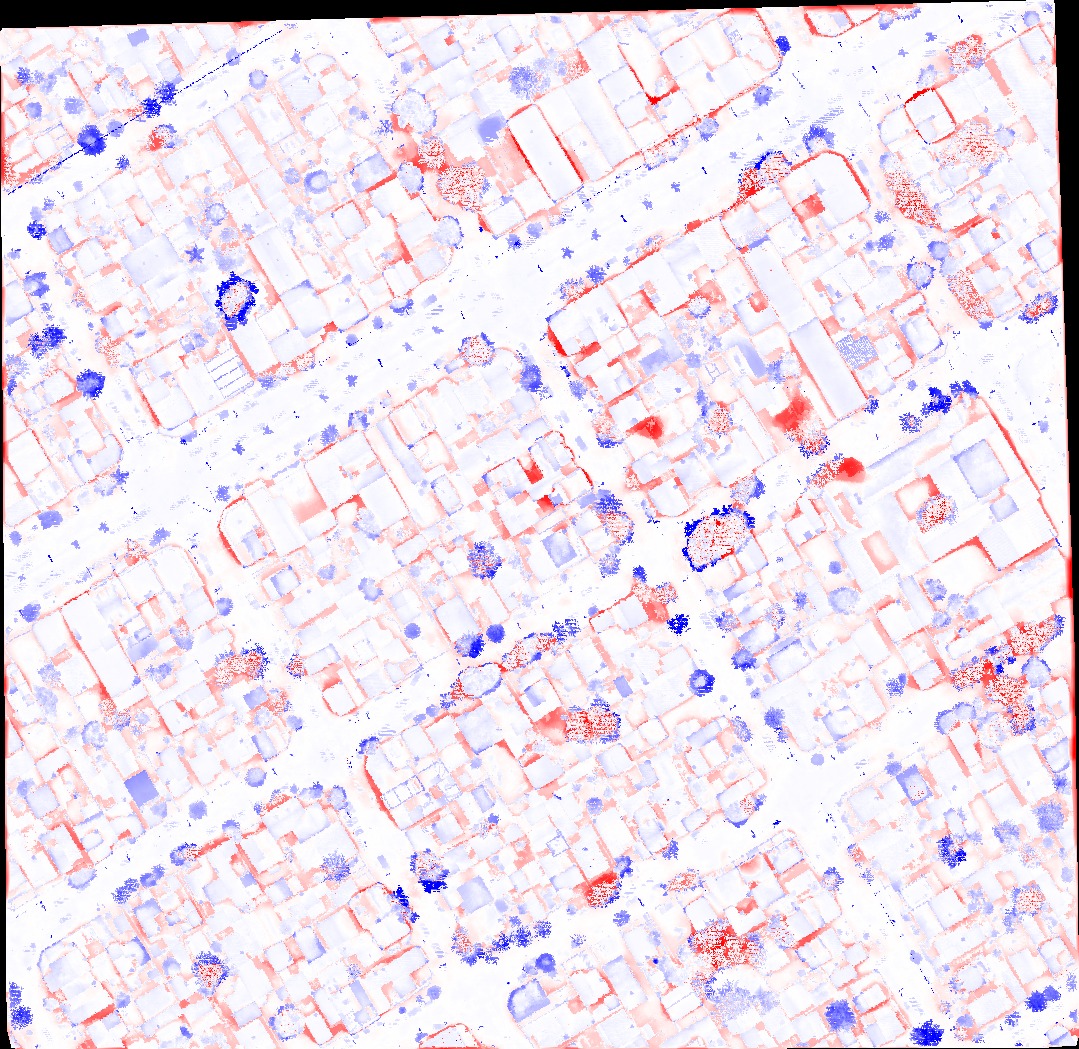
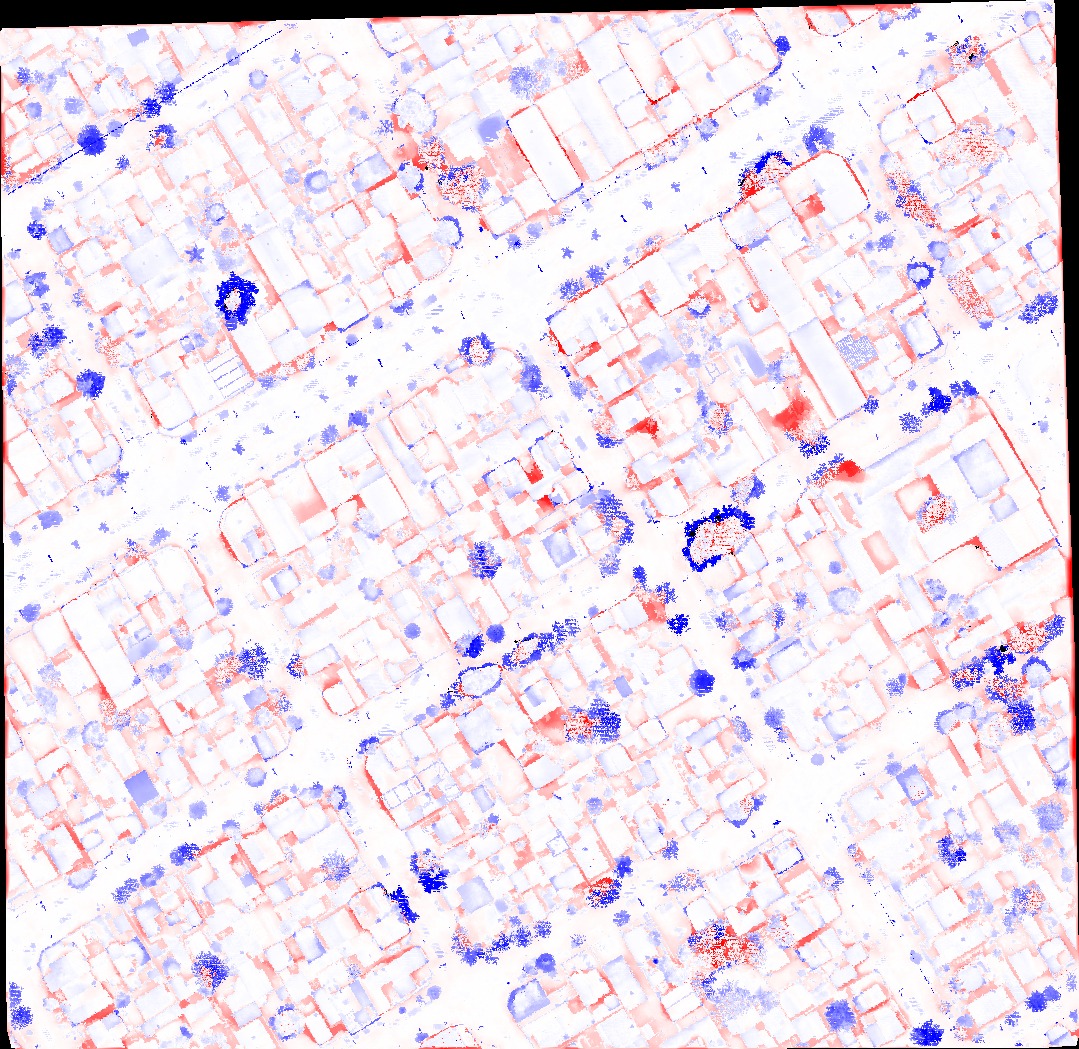
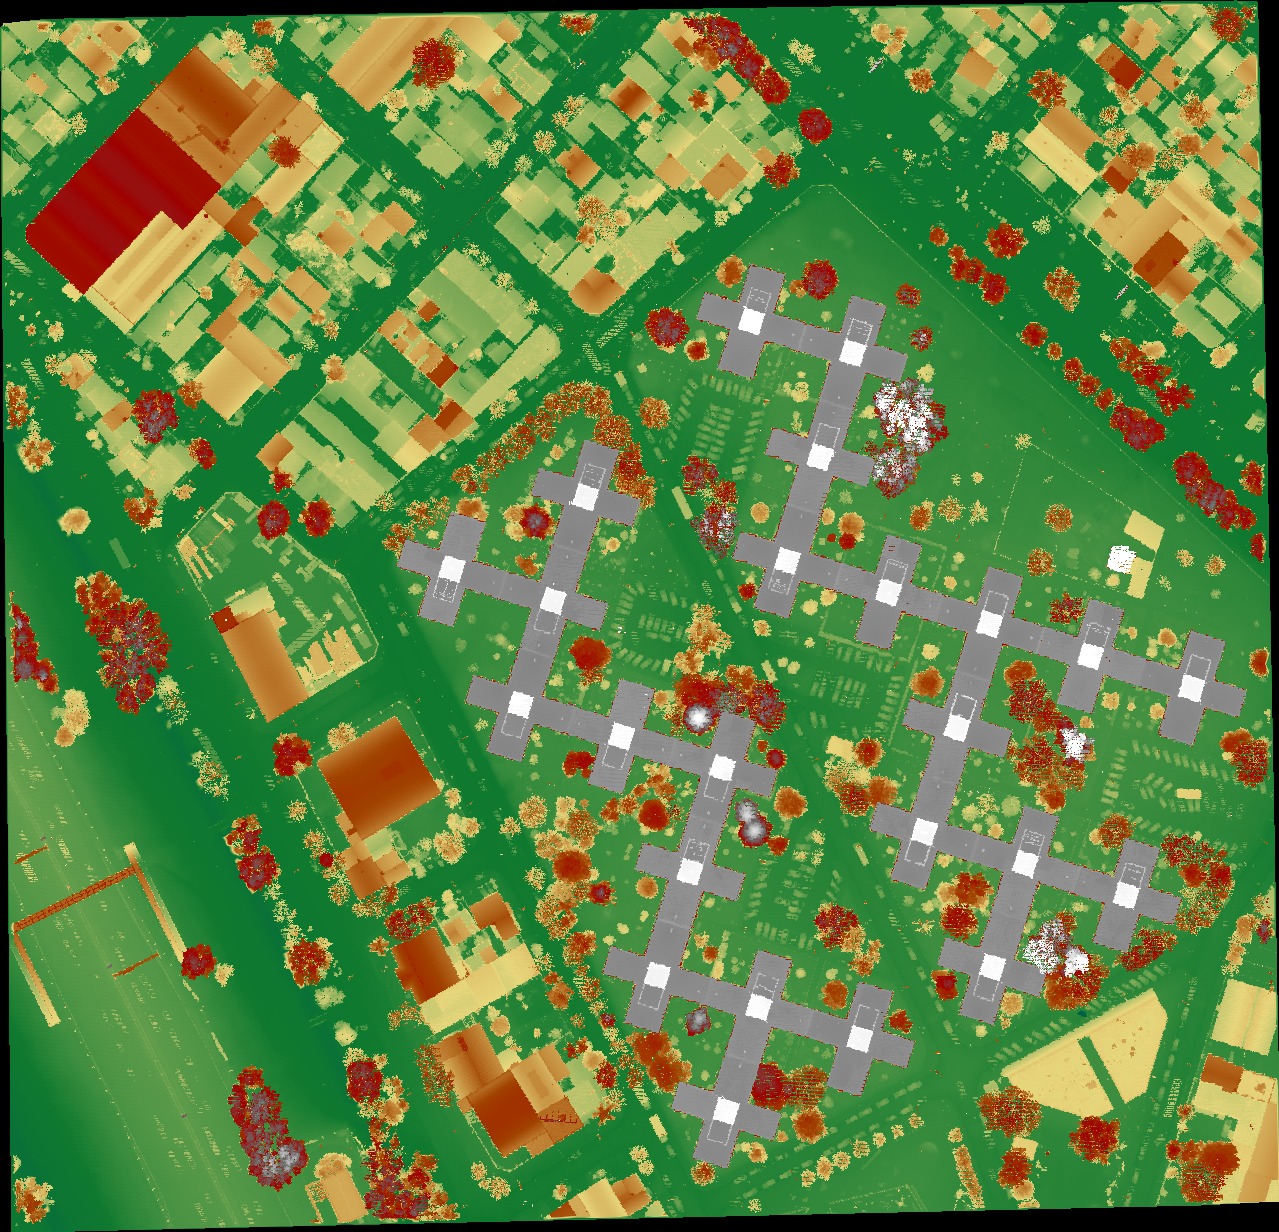
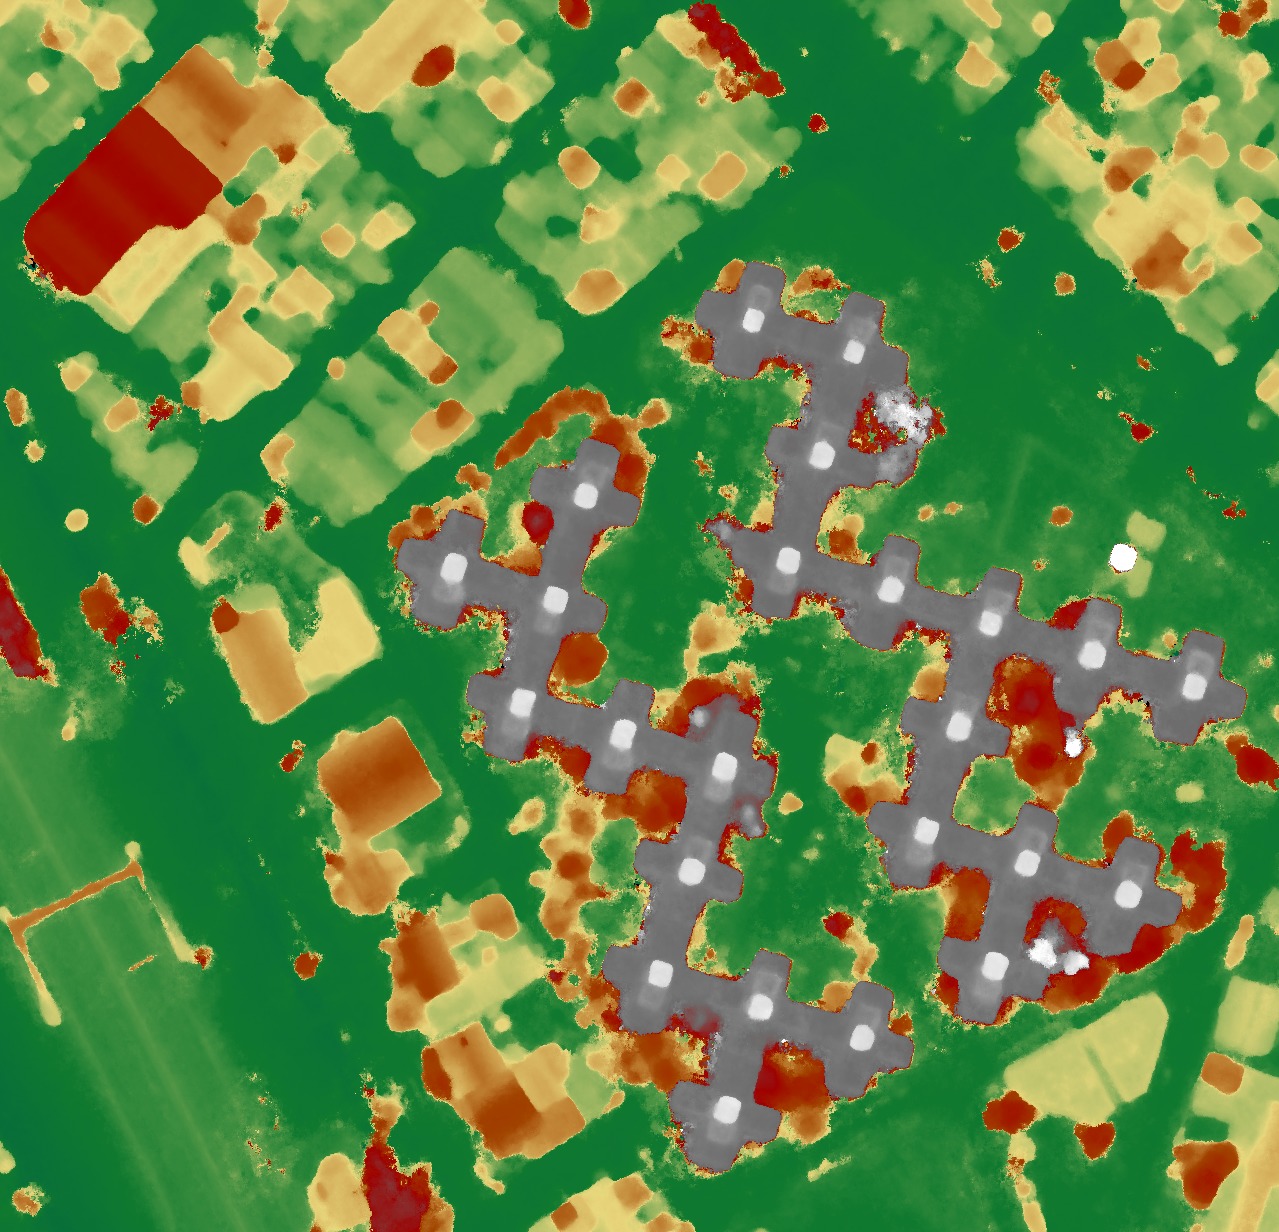
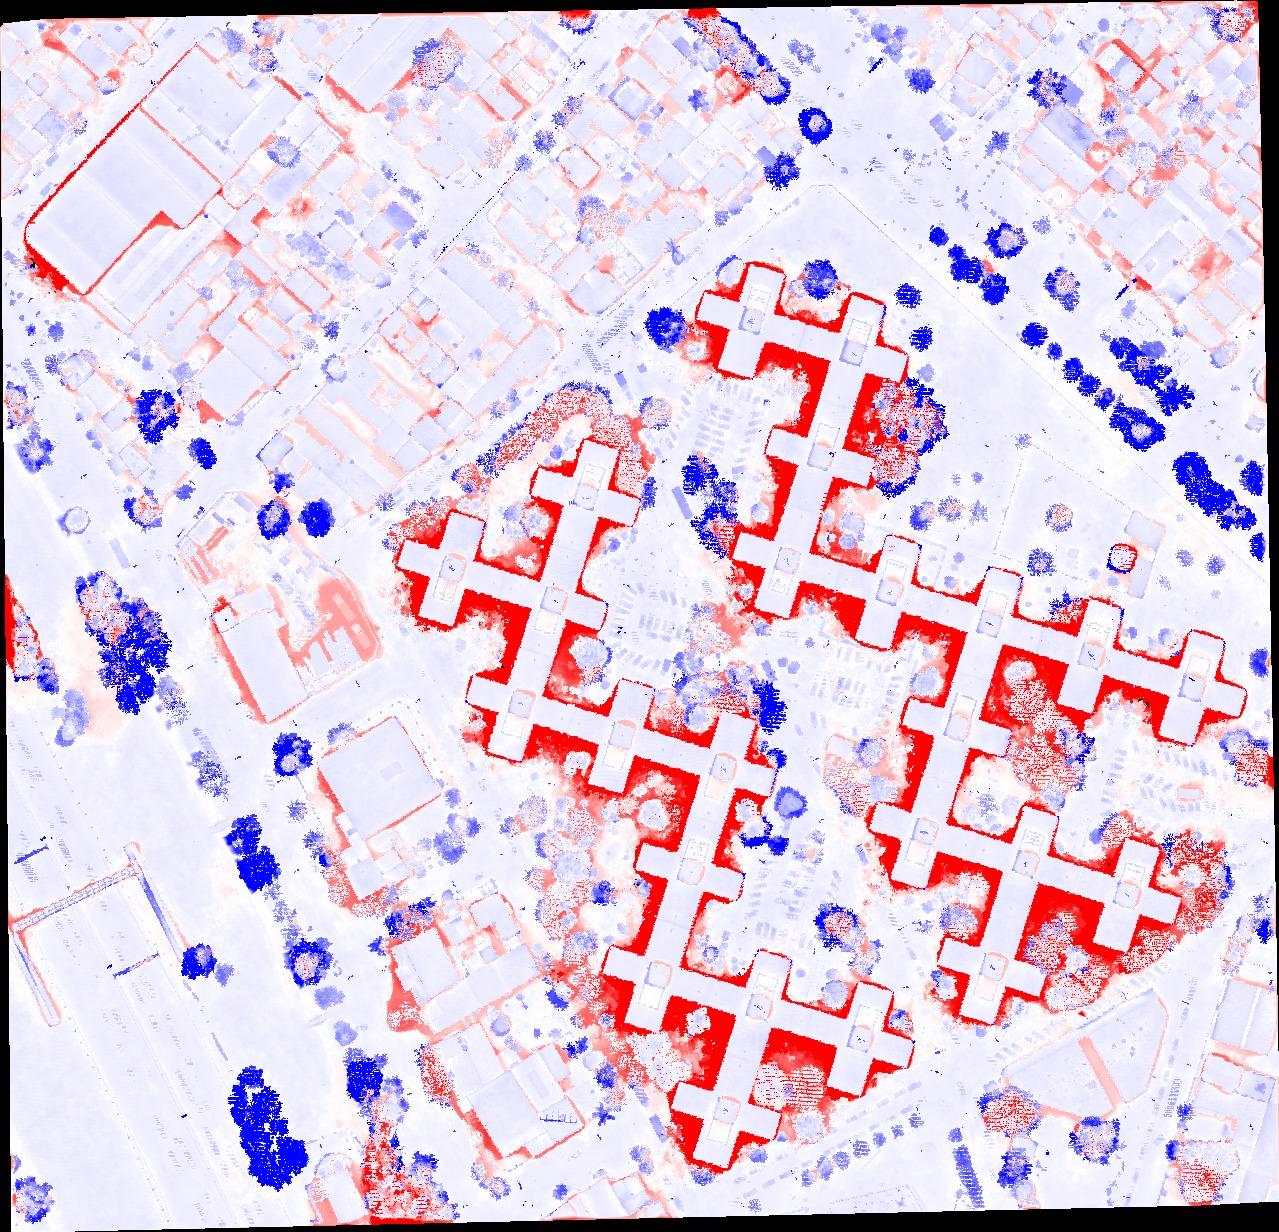
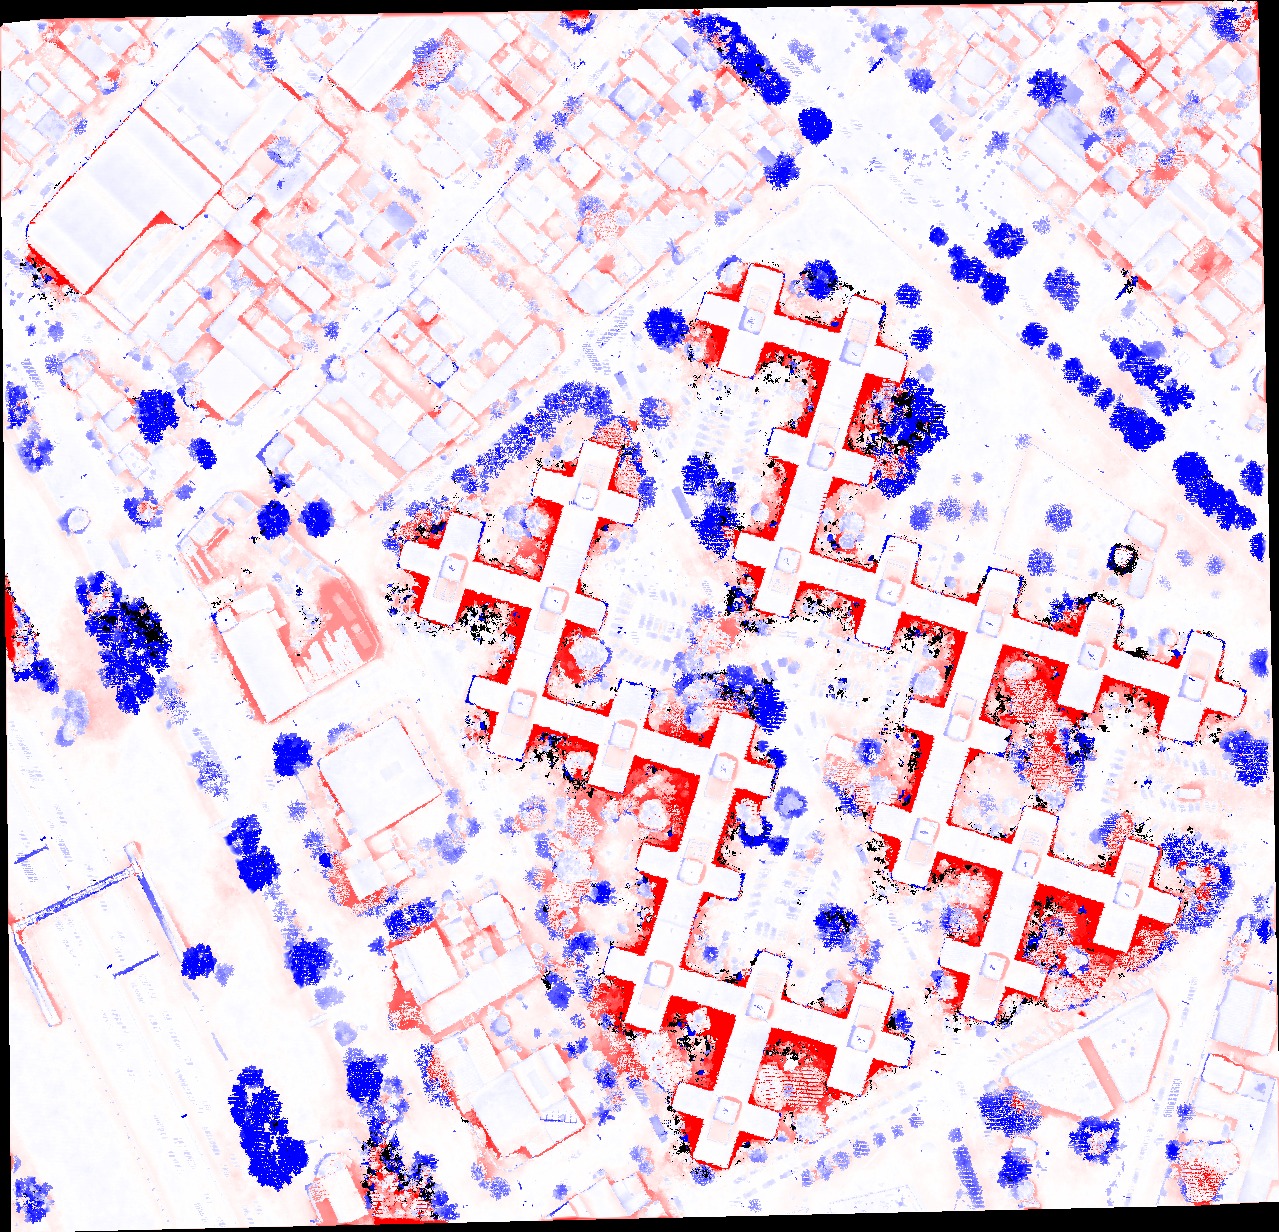
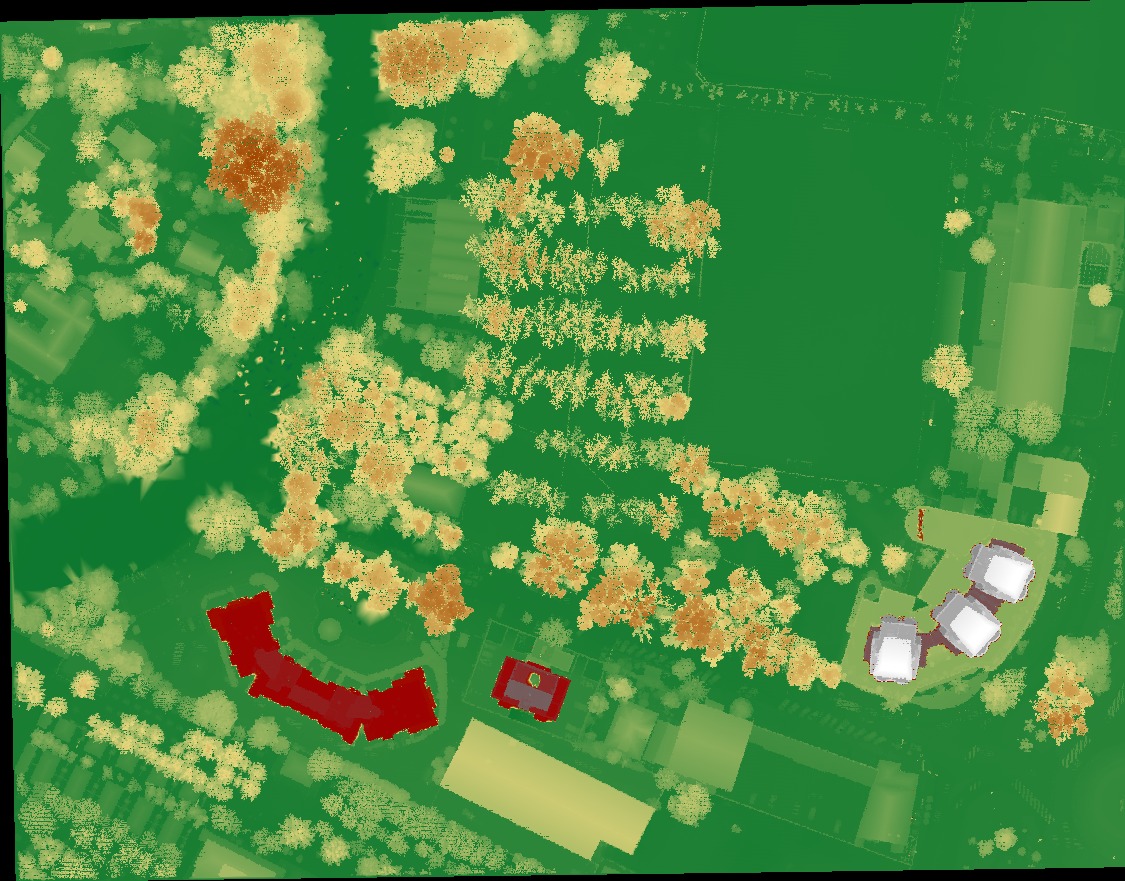
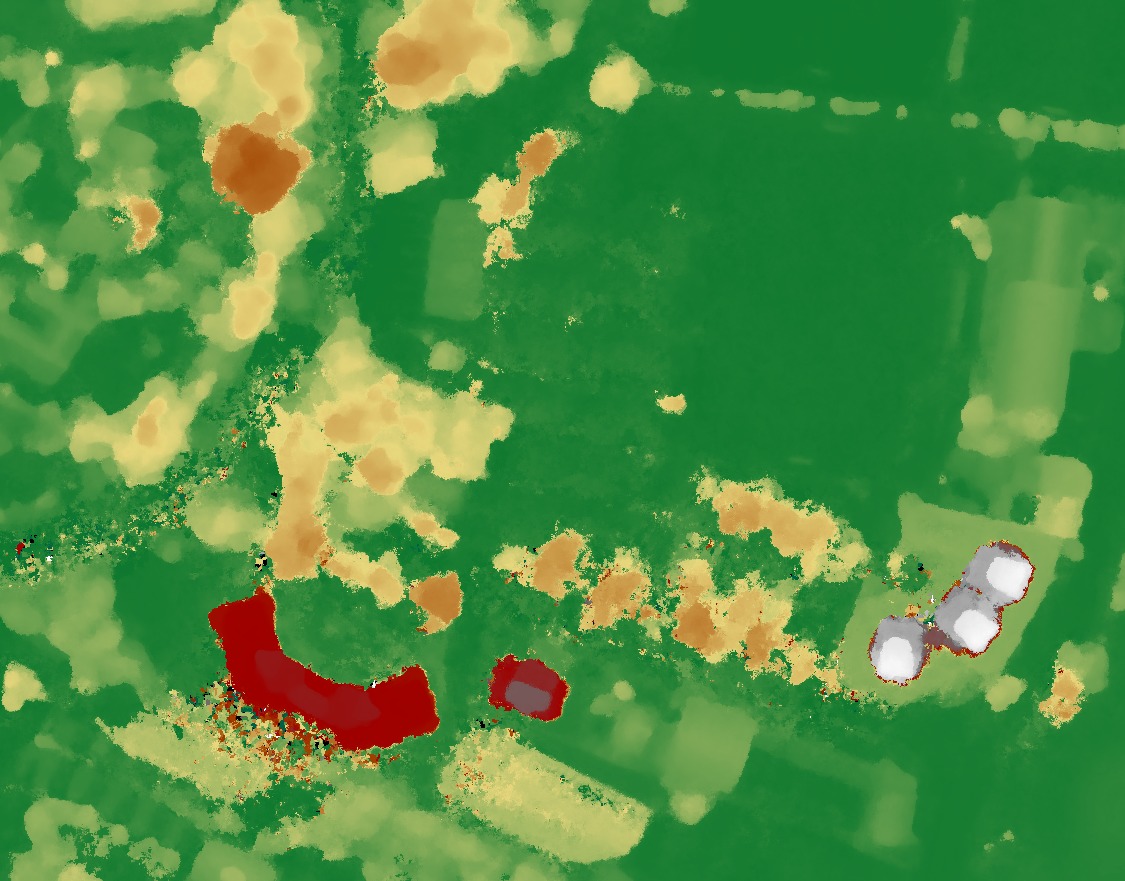
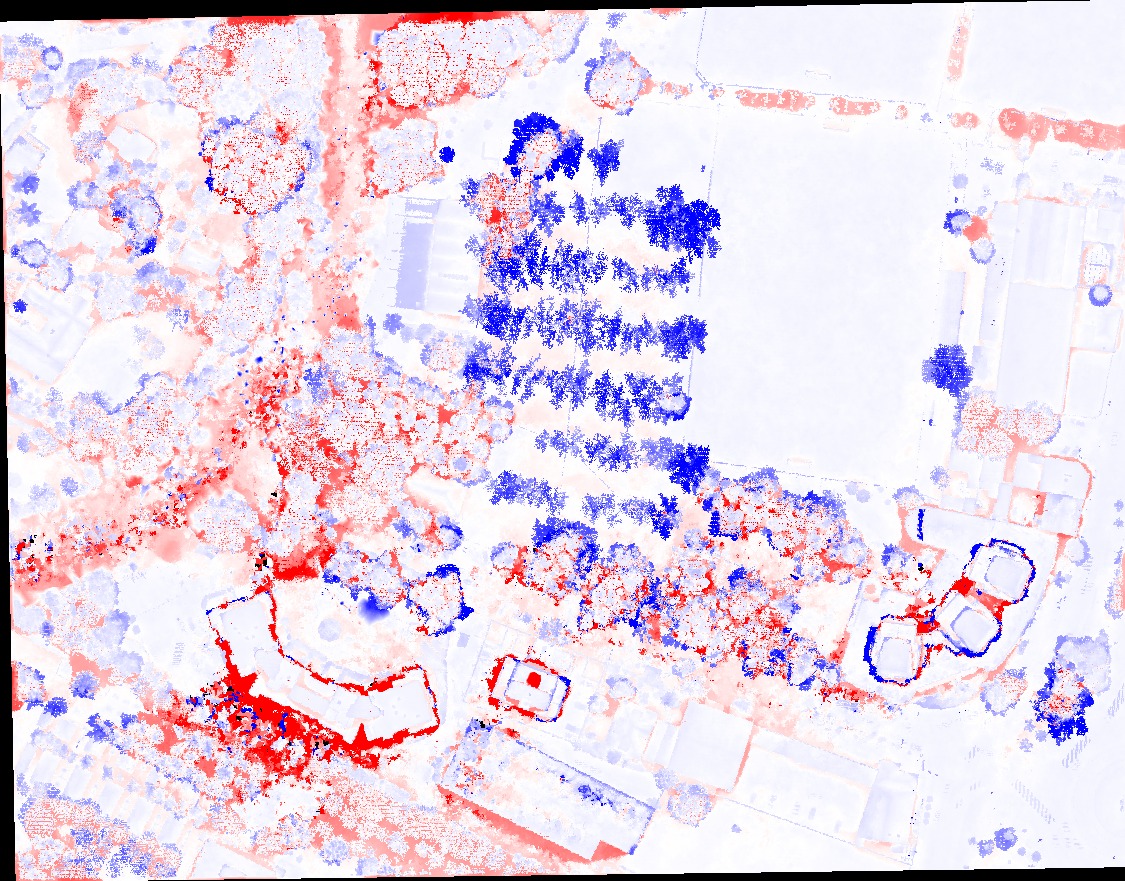
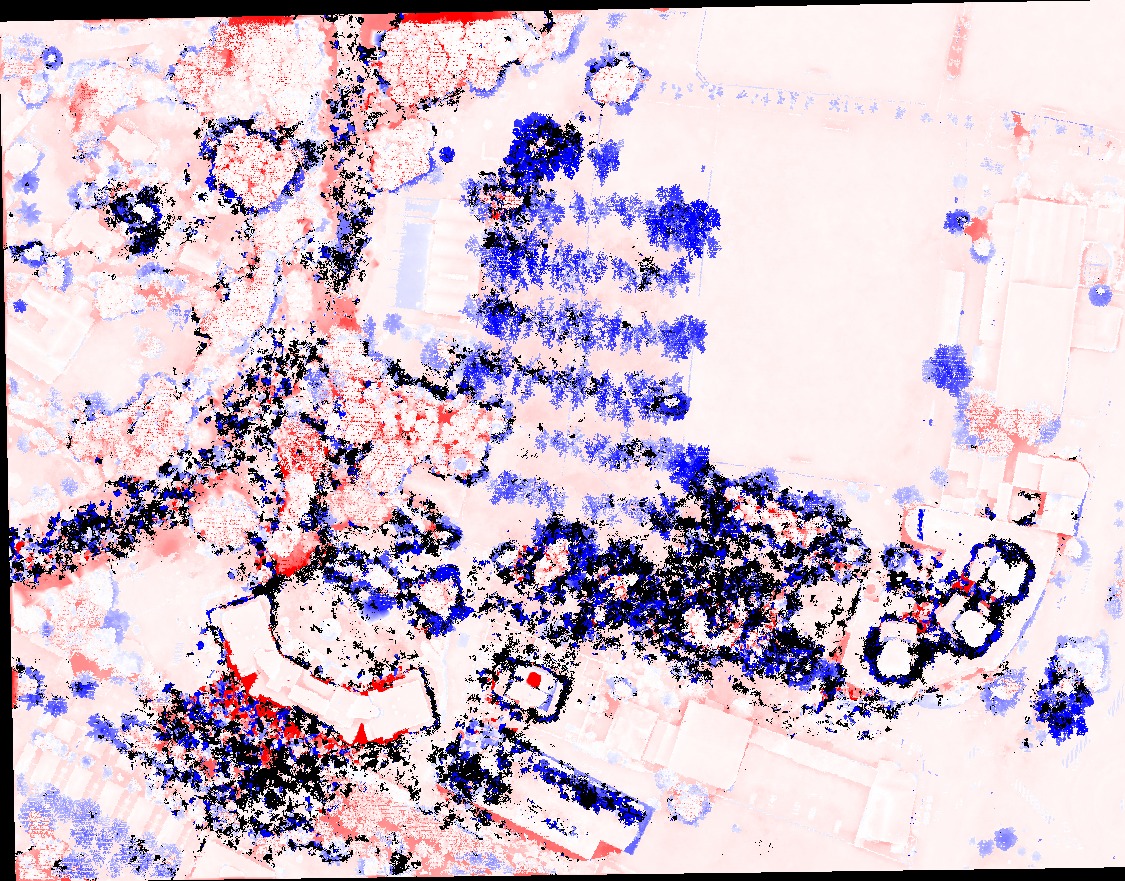
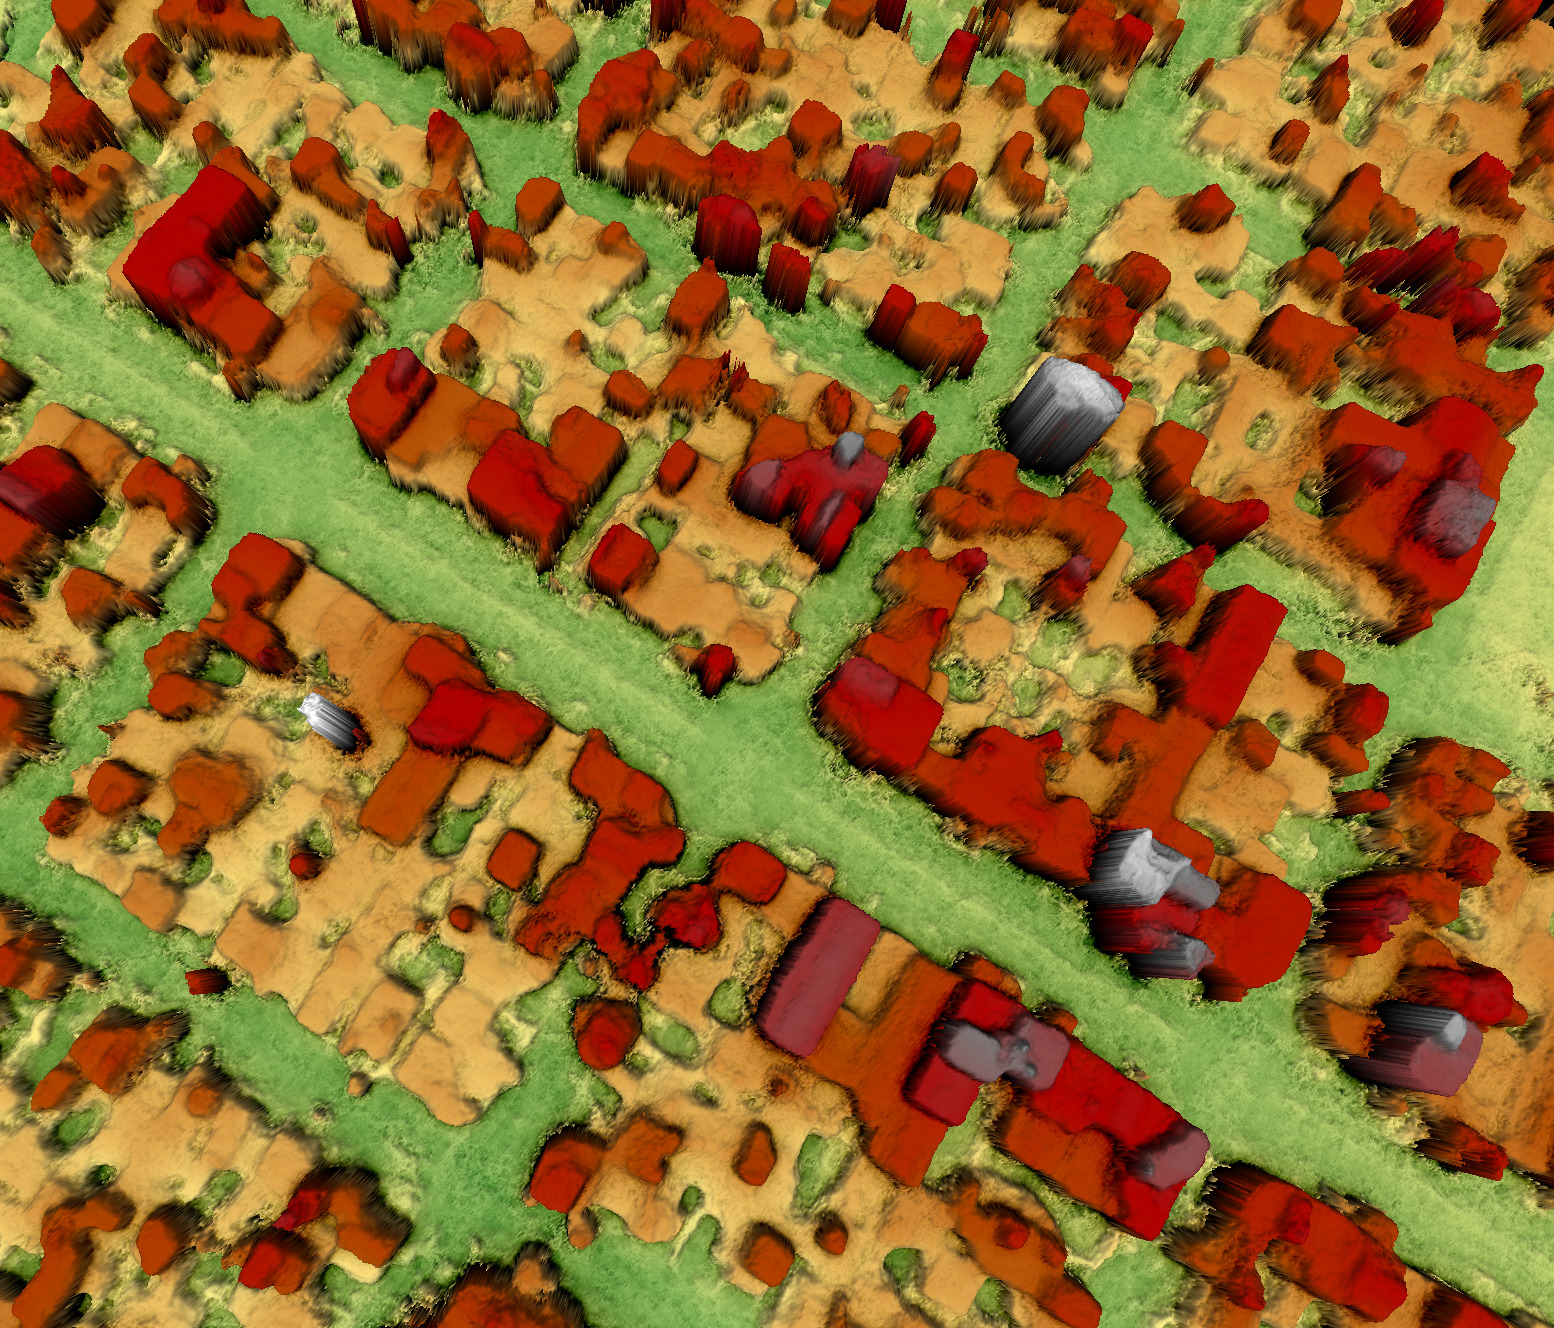
All the results below are obtained by merging the DSM obtained from the first N image pairs (usually N=50). The image pairs are ordered according to the proposed heuristic criterion described in the paper. The heights are in meters.Training site
Click on to flip between different point clouds (full screen):
download colored ply:
gt,
median 700,
median 50,
k-medians 50
to flip between different point clouds (full screen):
download colored ply:
gt,
median 700,
median 50,
k-medians 50